

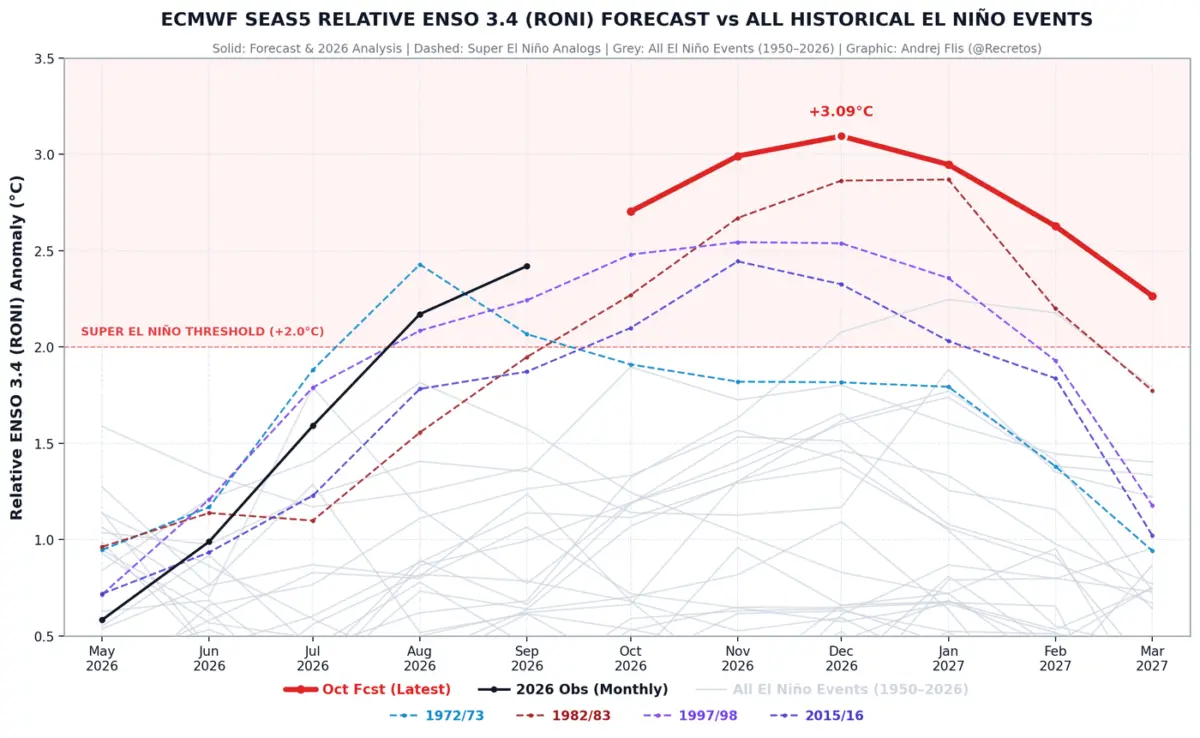
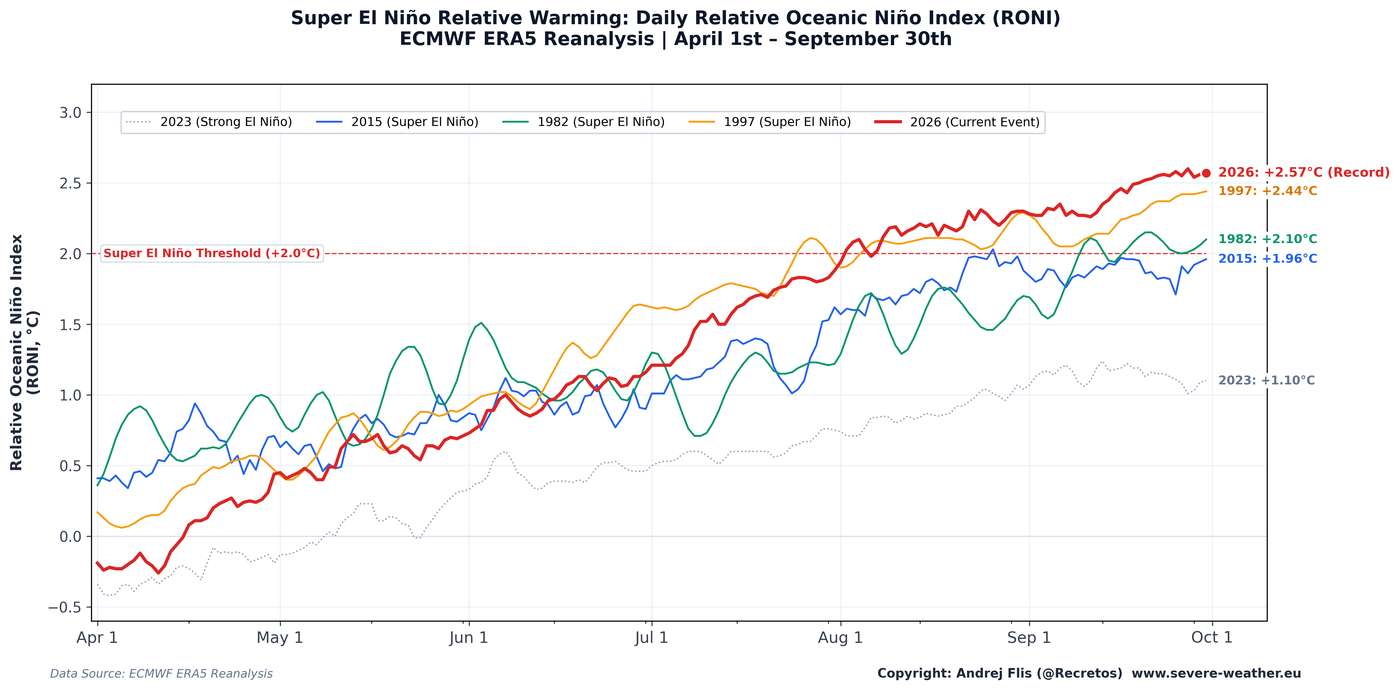
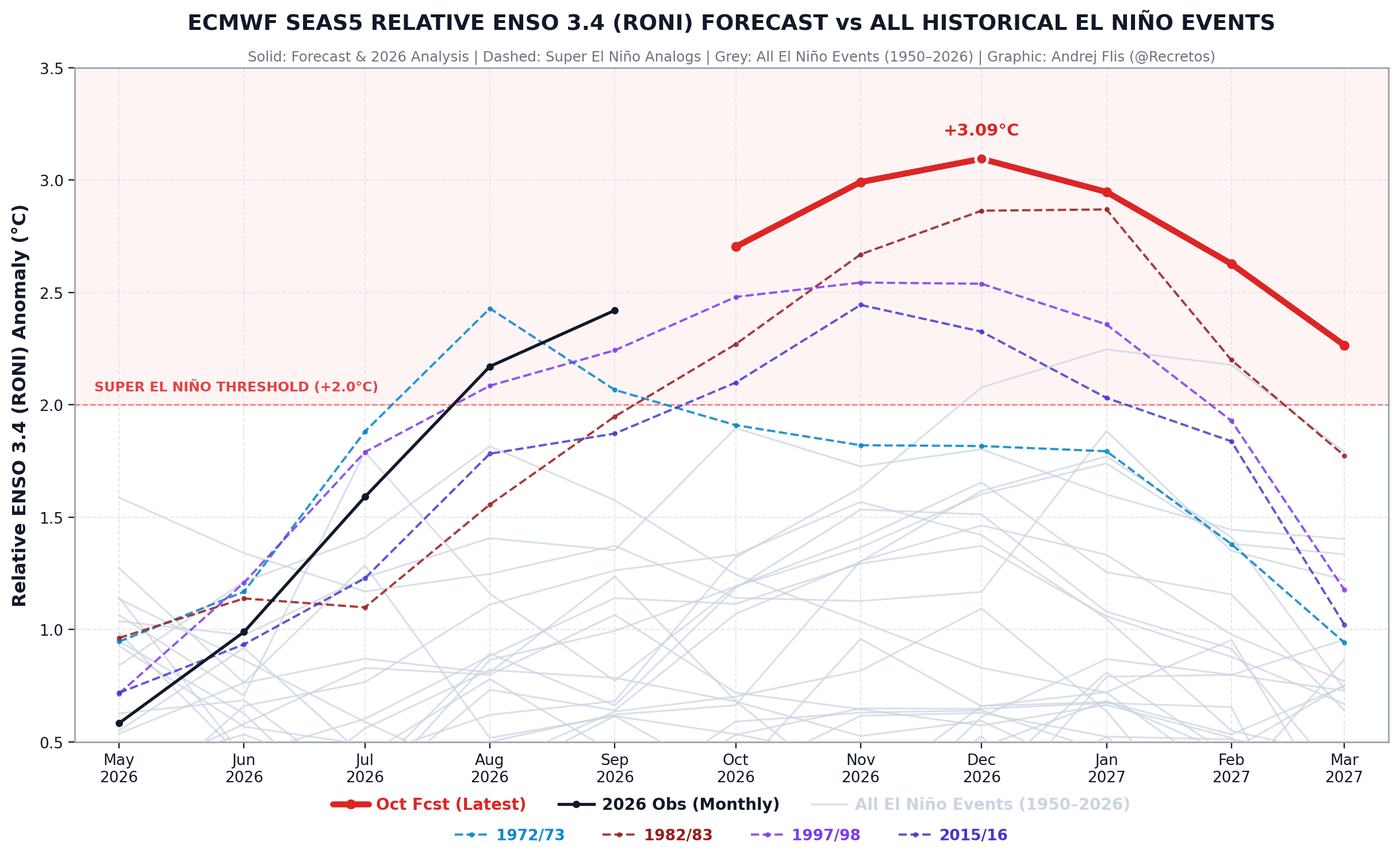
GLOBAL — As meteorological agencies monitor unprecedented thermal anomalies across the equatorial Pacific, long-range forecasting models have locked onto a formidable climate driver for the upcoming cold season. The unfolding Winter 2026/2027 is officially tracking under the influence of a historic Super El Niño—one that climate data indicates could rank as the strongest in over 75 years, outperforming even the benchmark events of 1982–1983 and 2015–2016.
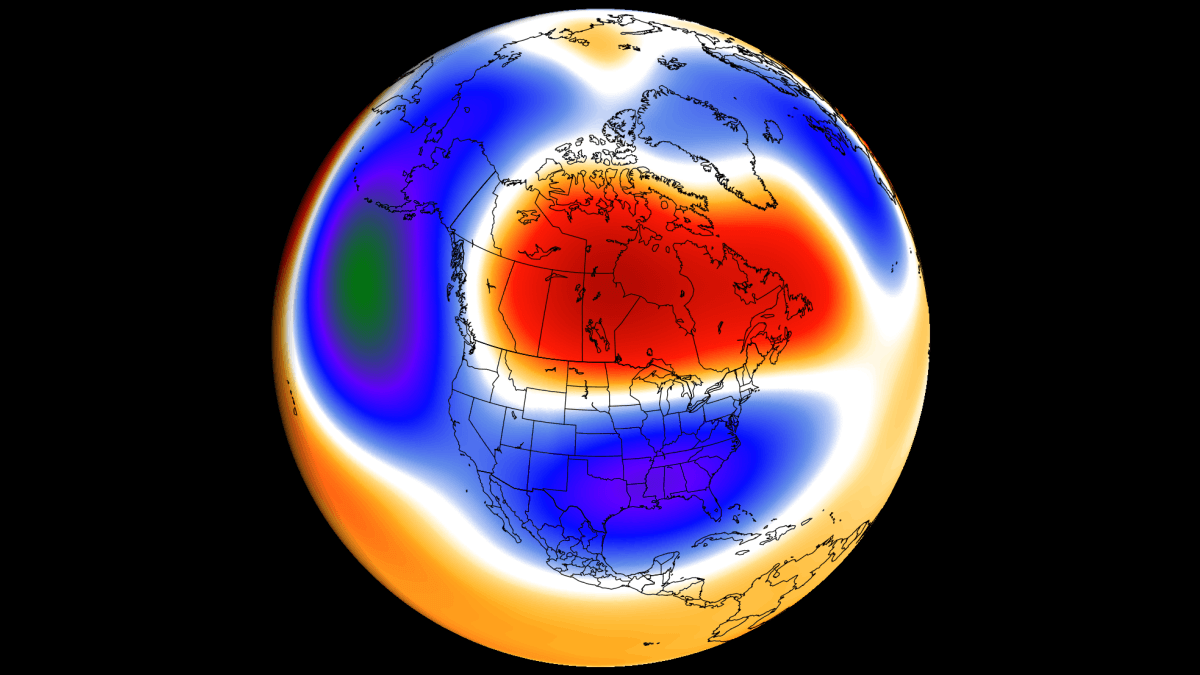
While conventional wisdom often equates El Niño winters with universally mild conditions, historical precedents and the latest October European Centre for Medium-Range Weather Forecasts (ECMWF) data reveal a far more complex, polarized reality. Meteorologists warn that the upcoming season will feature a volatile split: a warm, high-pressure-dominated northern tier contrasting sharply with an active, stormy, and increasingly cold south-central and eastern United States, alongside a significant mid-winter disruption of the stratospheric Polar Vortex.
Main Facts: The Anatomy of a Record-Breaking Super El Niño
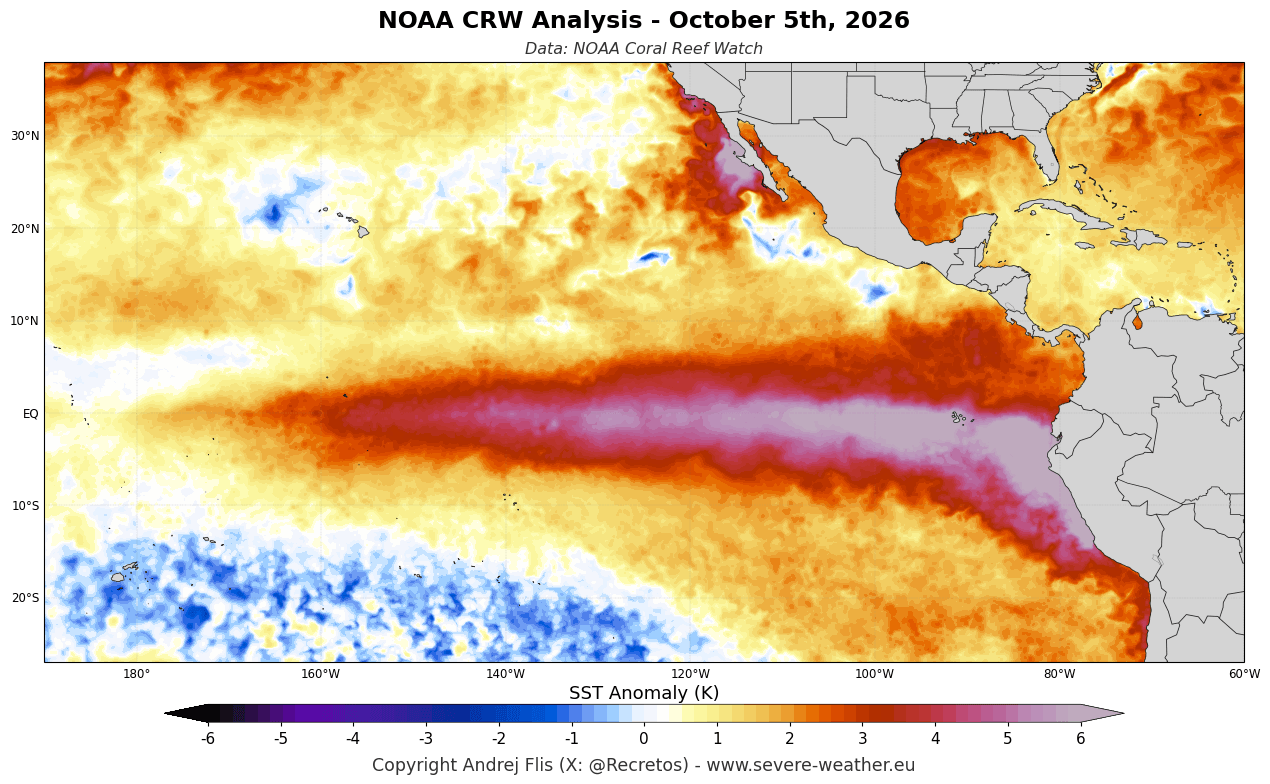
The primary driver behind the Winter 2026/2027 outlook is the rapid escalation of sea surface temperatures (SSTs) in the El Niño–Southern Oscillation (ENSO) region. Utilizing NOAA Coral Reef Watch (CRW) data and Relative Oceanic Niño Index (RONI) calculations recognized by the World Meteorological Organization (WMO), analysts have mapped temperature anomalies soaring well over 6°C (11°F) above normal in the eastern Pacific.
- Historical Scale: The current event is tracking ahead of all comparable cycles since 1950. WMO assessments place the probability of the event persisting and peaking at maximum intensity near December near 100%.
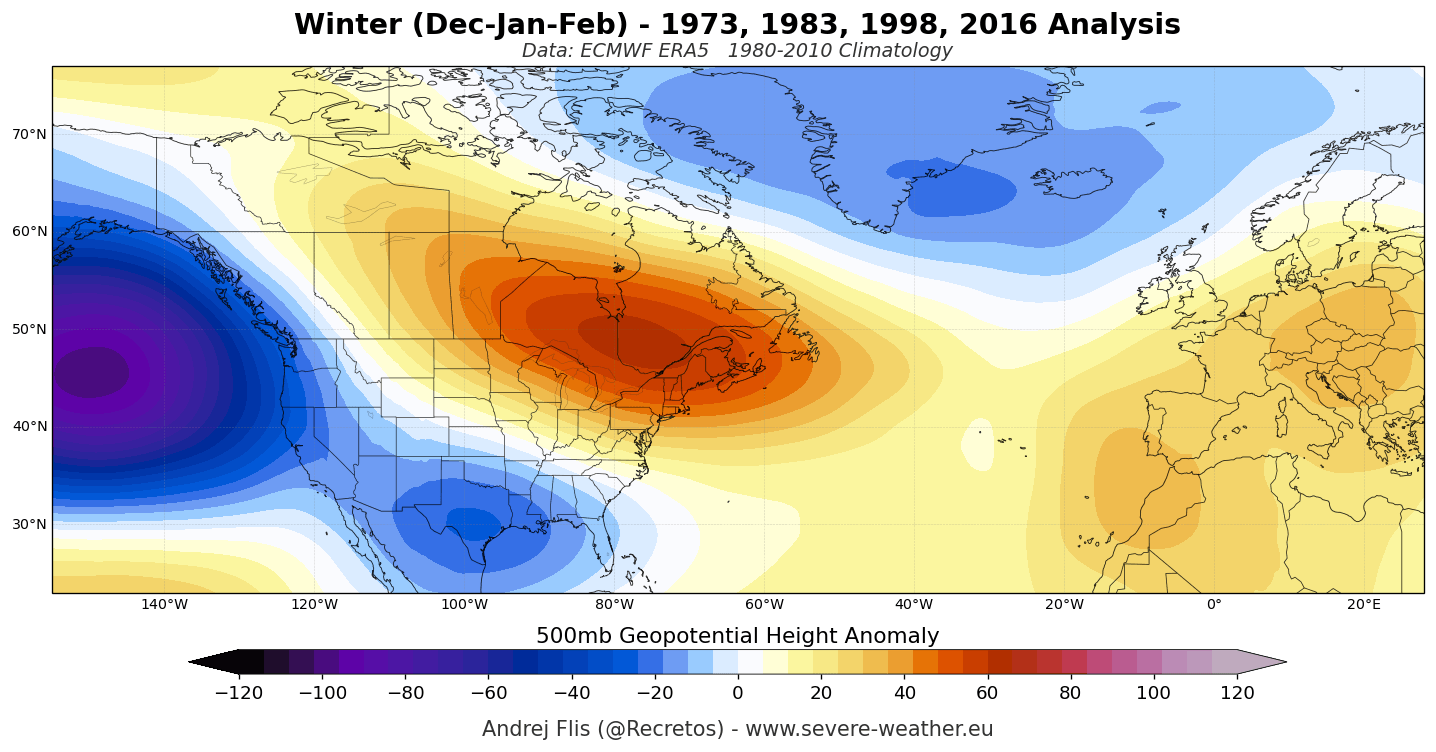
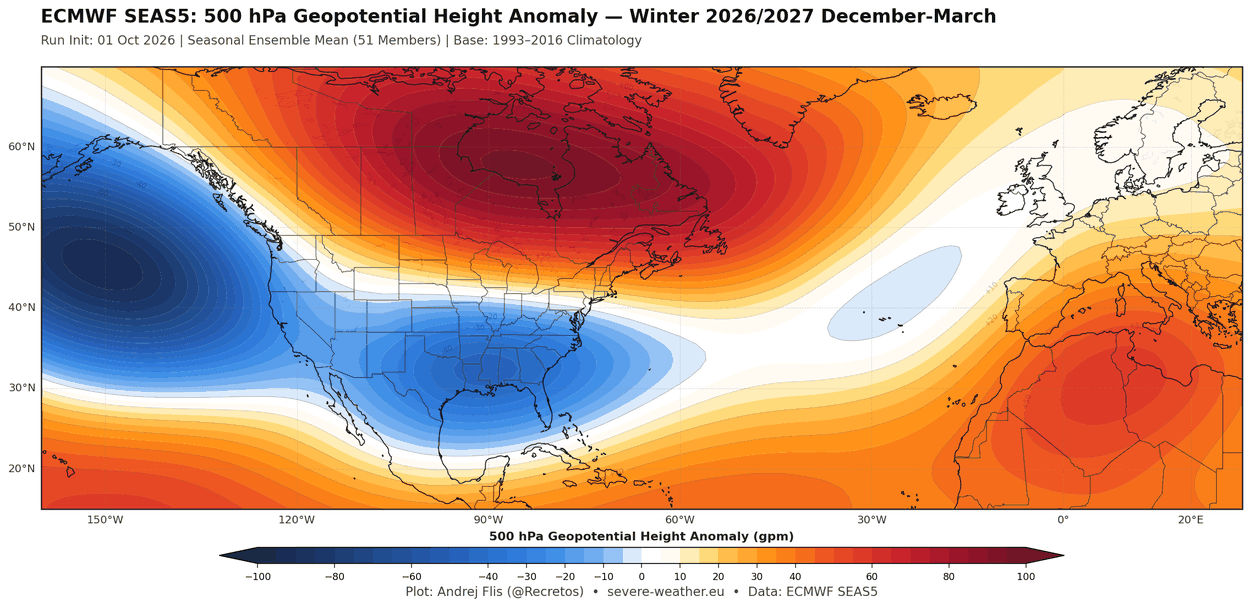
- Atmospheric Teleconnections: The immense thermal energy in the Pacific forces a profound atmospheric wave response. This translates into an expanded, deep Aleutian Low in the North Pacific and a formidable high-pressure blocking ridge anchored over Canada and the northern United States.
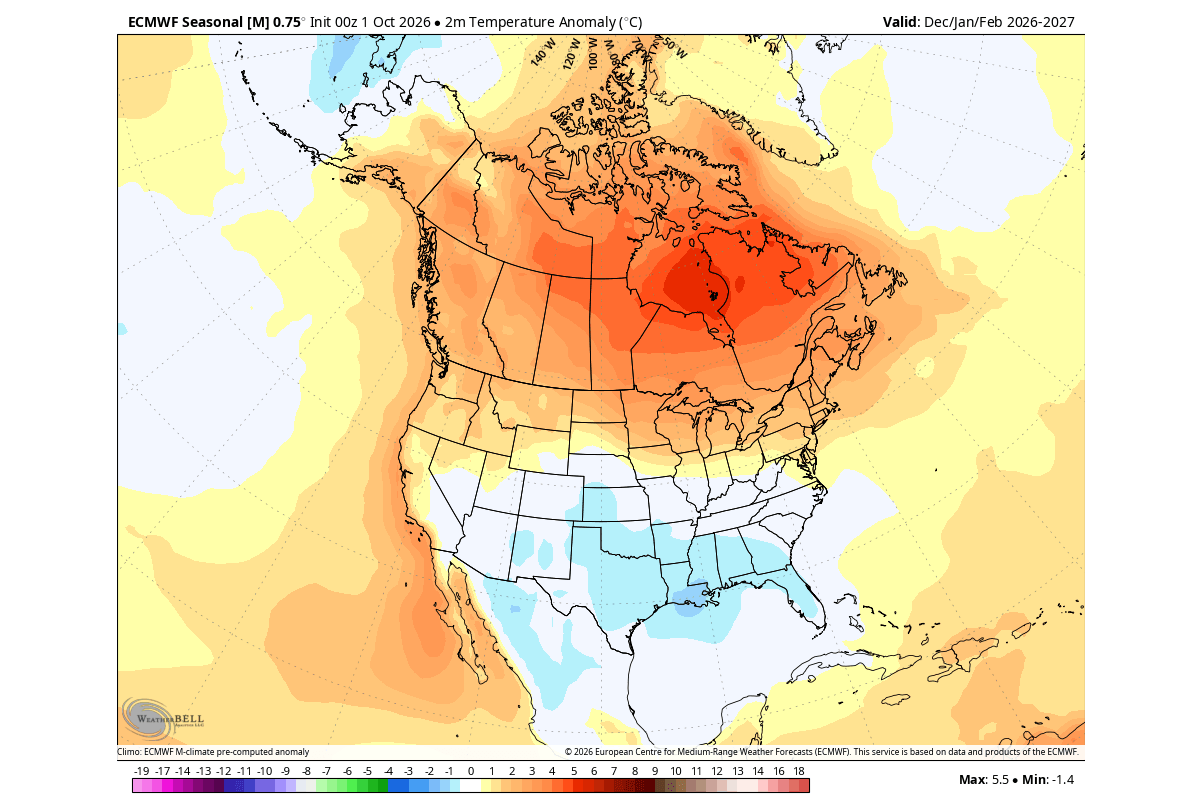
- Geographic Polarization: The resulting atmospheric configuration establishes a powerful southern jet stream, steering continuous moisture, active storm tracks, and below-normal temperatures into the southern, central, and eastern United States. Conversely, western Canada, the Pacific Northwest, and the northern U.S. plains are favored to experience a predominantly mild, drier regime.
Chronology of Past Super El Niño Winters: Lessons from History
To understand the potential severity of the coming months, meteorologists frequently look back at how previous Super El Niño winters materialized. While every season possesses unique variables, the structural atmospheric footprints of past events demonstrate a consistent capacity for extreme weather.
1. The Great Southeastern Snowstorm (1972/1973)
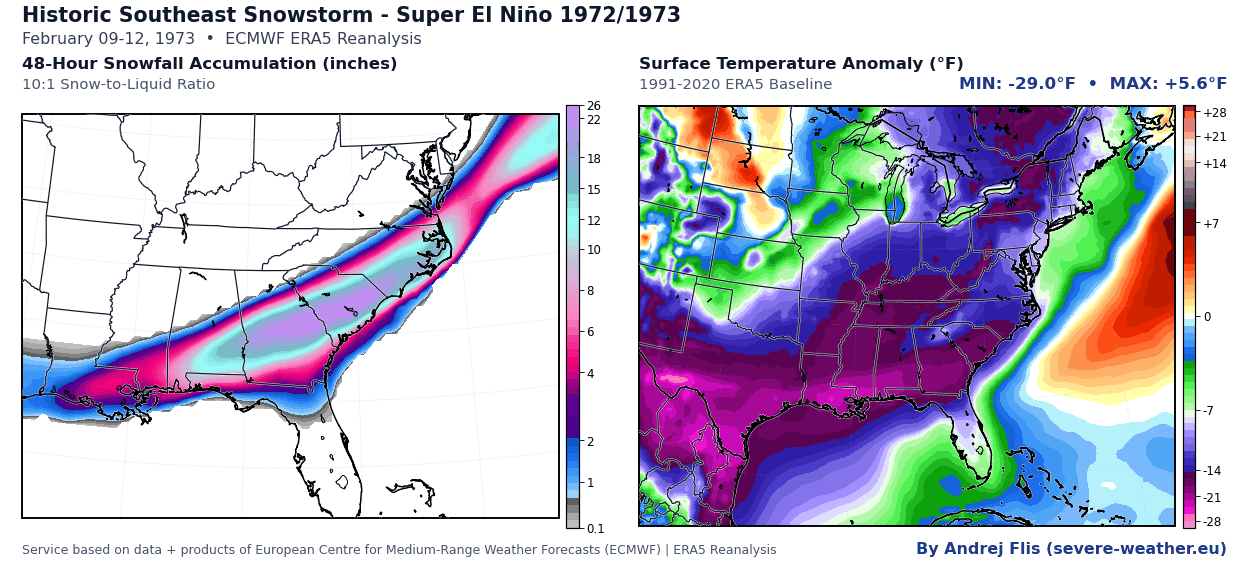
In February 1973, a strengthening low-pressure system originating in the Gulf of Mexico tapped into the southern jet stream, delivering one of the most destructive and expansive snowstorms in the history of the American Southeast. Coastal and interior cities experienced paralyzing accumulations—Rimini, South Carolina, recorded an astonishing 24 inches of snow, while Macon, Georgia, measured 16.5 inches. Snow fell as far south as Savannah and Tallahassee, Florida, trapping motorists and stranding communities for days under snowdrifts reaching up to eight feet.
2. The Megalopolitan Blizzard (1982/1983)
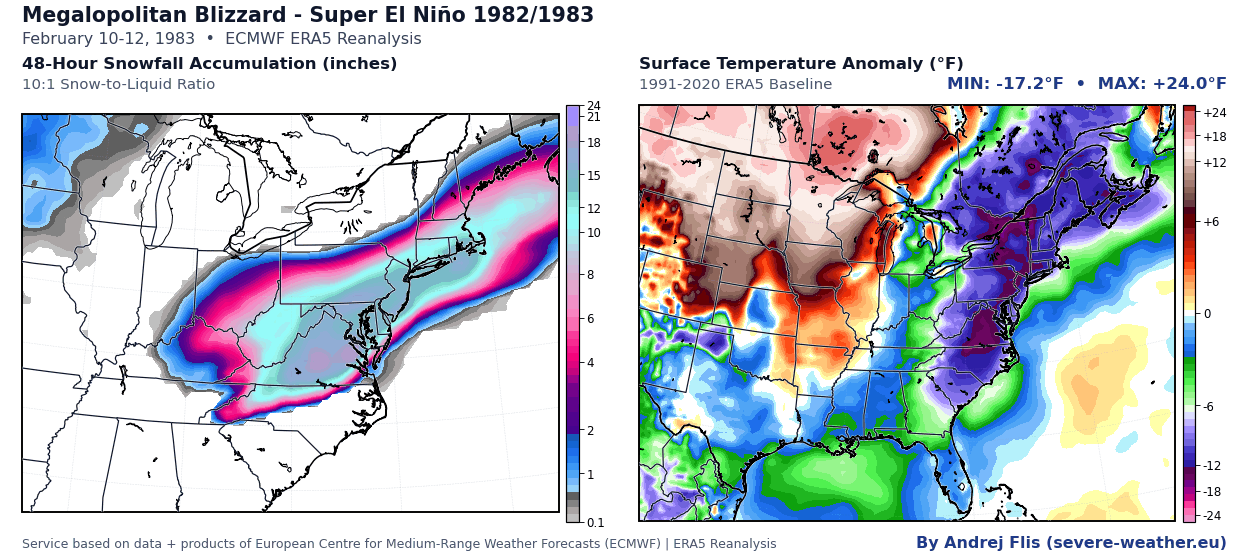
The classic winter of 1982/1983 coincided with a peak Super El Niño phase, culminating in a historic nor’easter in February 1983. A powerhouse storm tracked up the I-95 corridor, dropping heavy snow at rates of 2 to 5 inches per hour. Major metropolitan centers including Baltimore and Philadelphia shattered their 24-hour snowfall records, picking up over 22 and 21 inches respectively. Widespread accumulations of 15 to 25 inches paralyzed the corridor from Washington, D.C., through New York City and into southern New England.
3. The Great Ice Storm of 1998
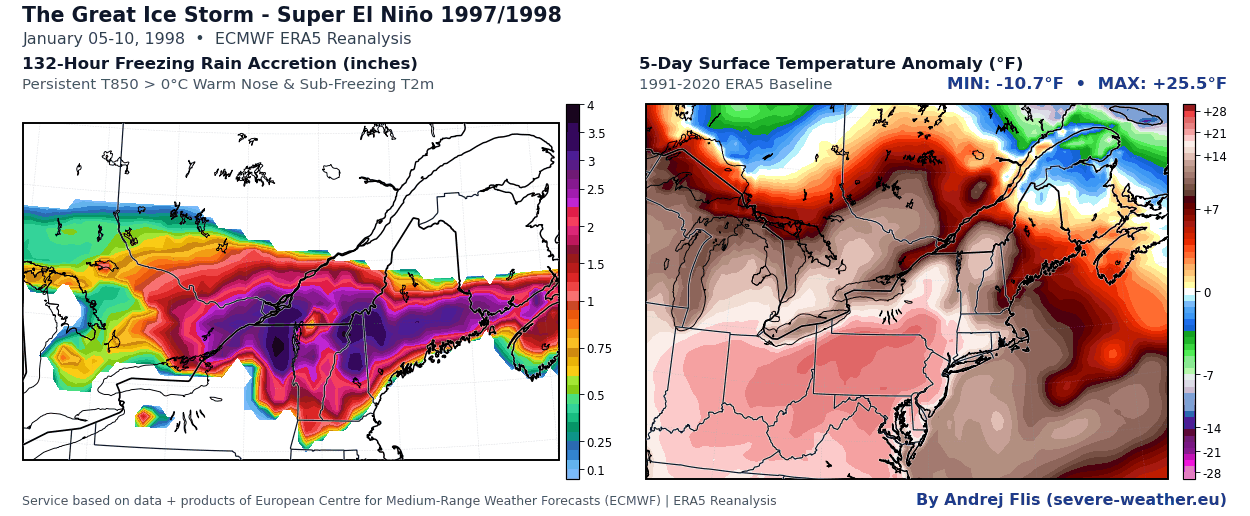
Shifting from heavy snow to catastrophic ice, the January 1998 Super El Niño event produced a historic freezing rain catastrophe across the Northeastern United States and southeastern Canada. Thick, relentless layers of ice accumulated over upstate New York, Vermont, New Hampshire, and Maine—where roughly 80% of the population lost electrical power, with some outages lasting over three weeks. Federal disaster declarations covered nearly all of Maine and Vermont, alongside vast swaths of Ontario and Quebec.
4. The Christmas Weekend Blizzard and 2016 Nor’easter (2015/2016)
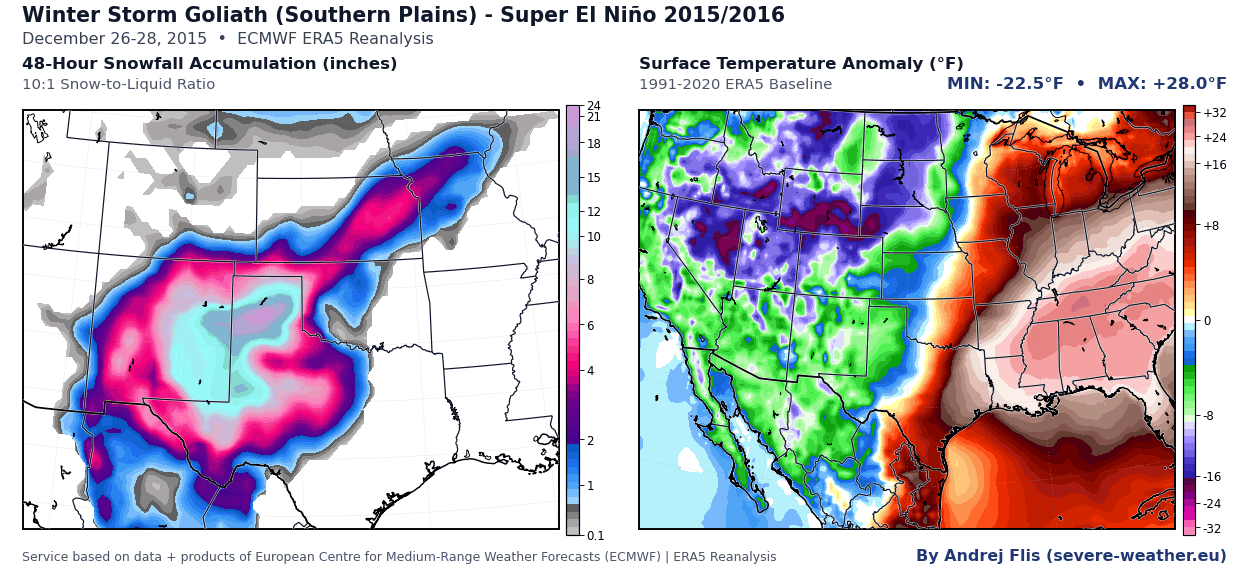
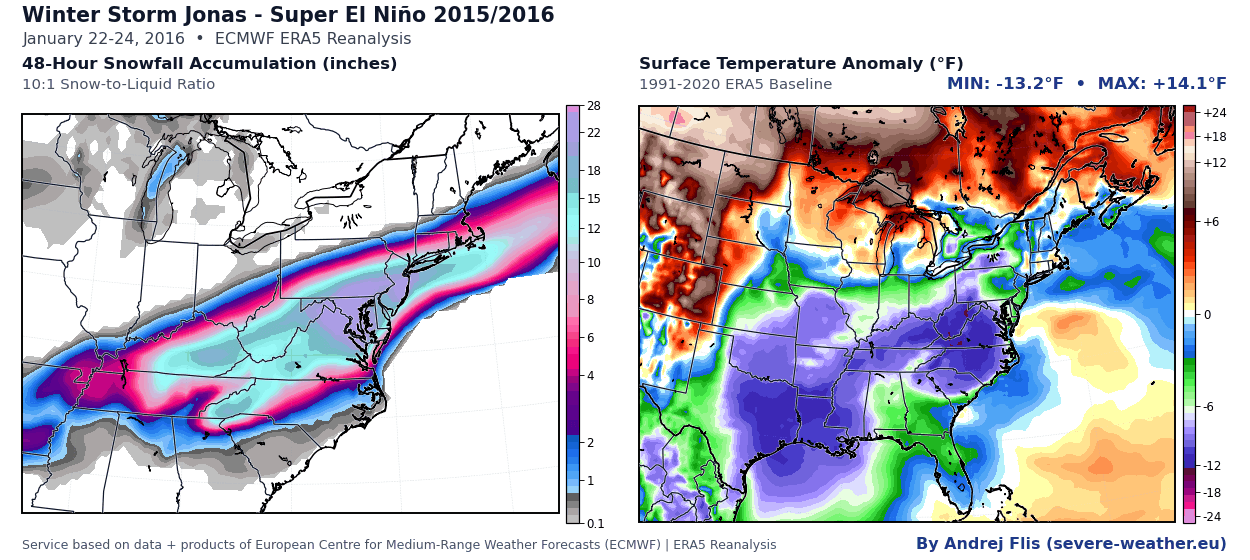
The most recent Super El Niño prior to the current cycle delivered a dual punch of historic winter weather. Immediately following Christmas 2015, an aggressive southern-track storm unloaded 2 to 3 feet of snow with 10-foot drifts across New Mexico, Texas, and Oklahoma, closing Interstate 40. Just weeks later, in January 2016, a Category 4 nor’easter buried the East Coast. Central Park recorded an all-time storm record of over 27 inches, while Baltimore measured a record-shattering 29 inches, directly impacting over 100 million Americans.
Supporting Data: The October ECMWF Model Shift
Seasonal forecasting models are dynamic, undergoing continuous refinement as boundary conditions are updated. The October ECMWF run released ahead of the winter season introduced notable shifts in pressure anomalies, temperature trends, and snowfall potential.
+-------------------------------------------------------------------------+
|                  OCTOBER ECMWF MODEL SHIFT SUMMARY                      |
+---------------------+---------------------------------------------------+
| Parameter           | Modeled Trend & Regional Impact                   |
+---------------------+---------------------------------------------------+
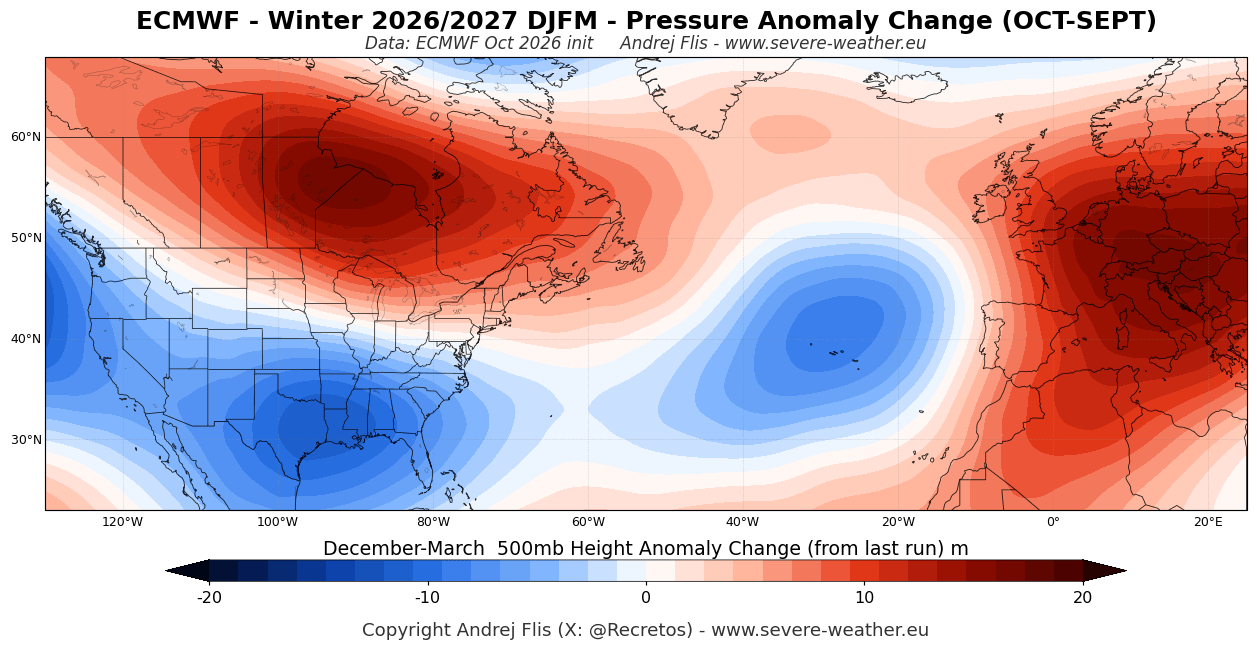
| Pressure Anomalies  | Intensified low-pressure zone over the U.S.;      |
|                     | strengthened high-pressure blocking over Canada.  |
+---------------------+---------------------------------------------------+
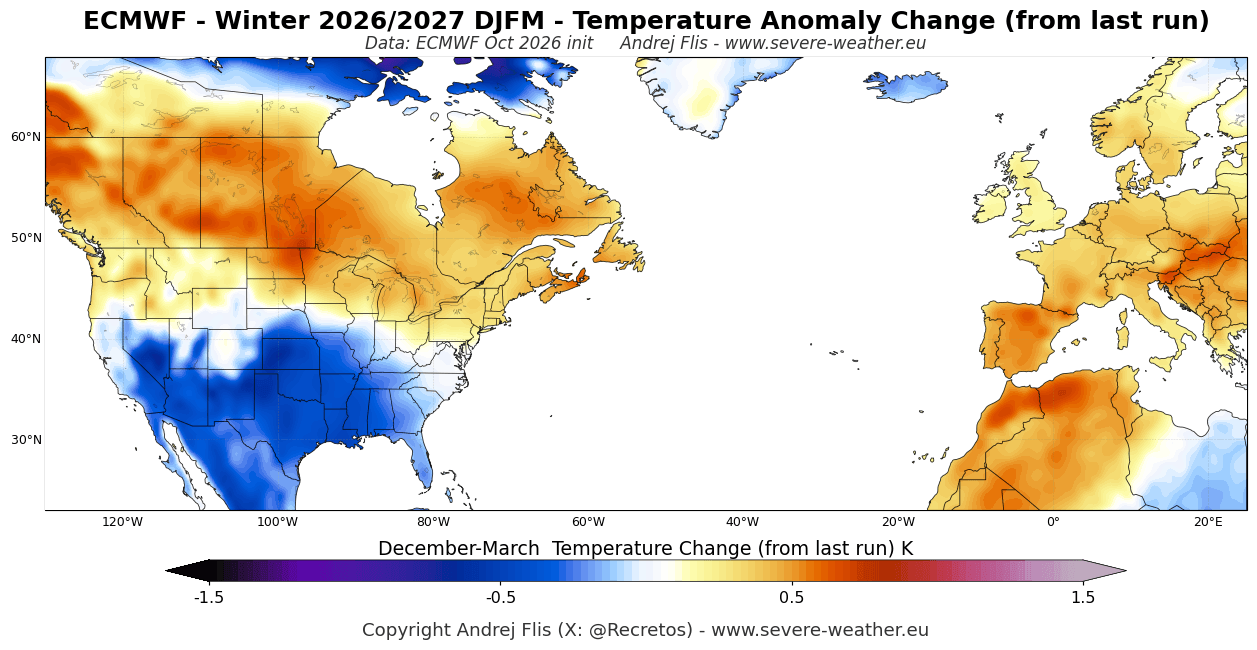
| Temperature Trends  | Colder trend developing across the southern half  |
|                     | of the U.S.; continued warmth in northern tier.   |
+---------------------+---------------------------------------------------+
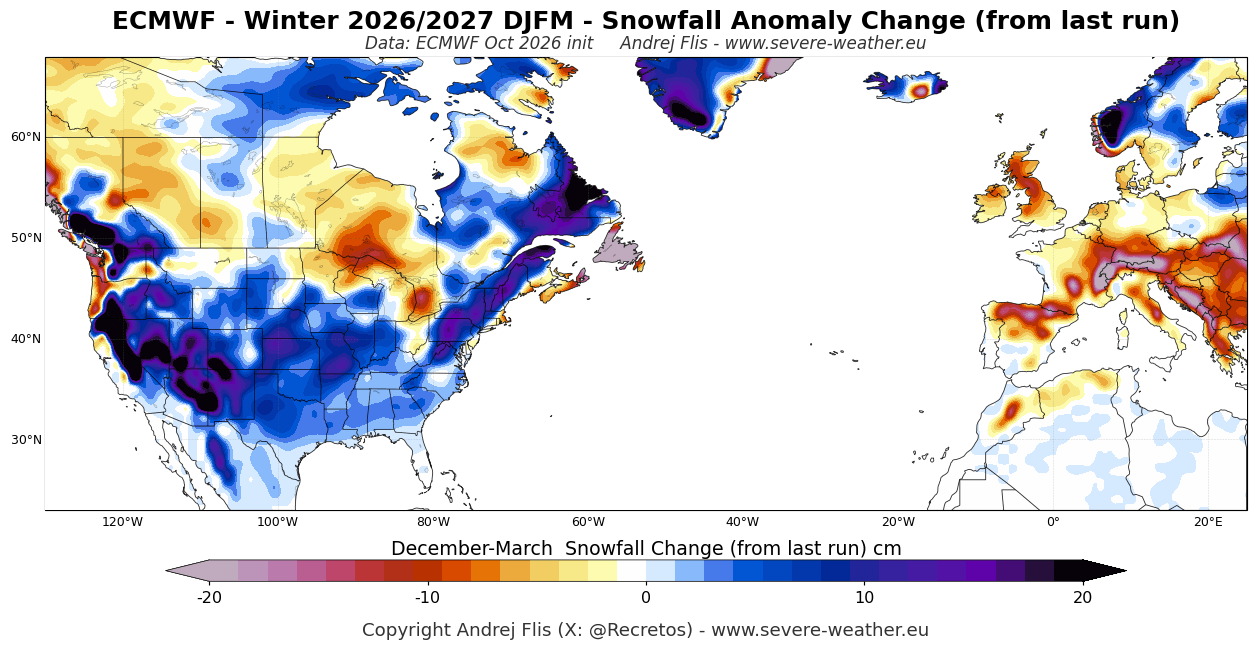
| Snowfall Potential  | Increased snow signal across the Central Plains,  |
|                     | Midwest, Ohio Valley, and Southern Appalachians.  |
+---------------------+---------------------------------------------------+
| European Outlook    | High-pressure dominance supporting a mild, wet    |
|                     | westerly Atlantic flow across the continent.      |
+---------------------+---------------------------------------------------+
Pressure and Jet Stream Dynamics
The latest pressure anomaly data reveals an intensification of the low-pressure zone across the United States coupled with an amplified high-pressure ridge over Canada. This configuration forces a steepened pressure gradient, energizing the Pacific jet stream and creating a "highway" for frequent storm systems to traverse the southern and eastern tiers of the country.
Temperature and Precipitation Anomalies
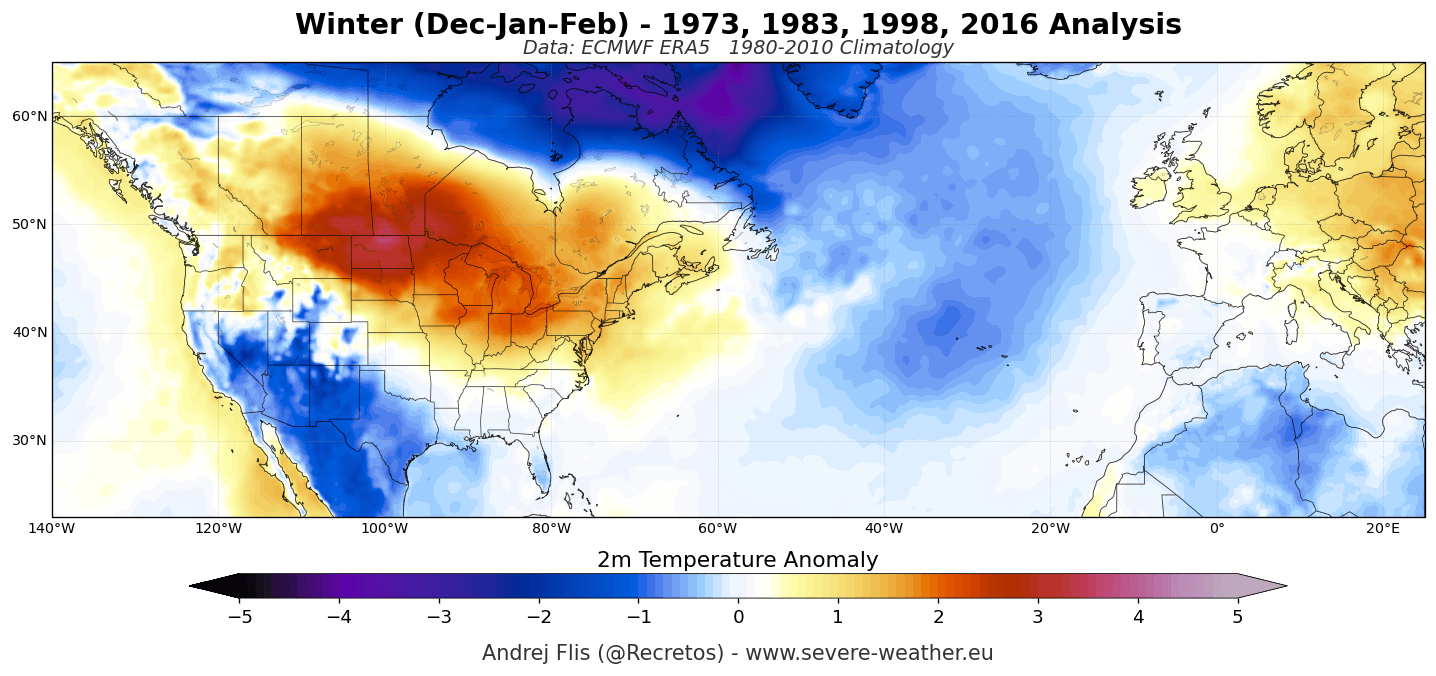
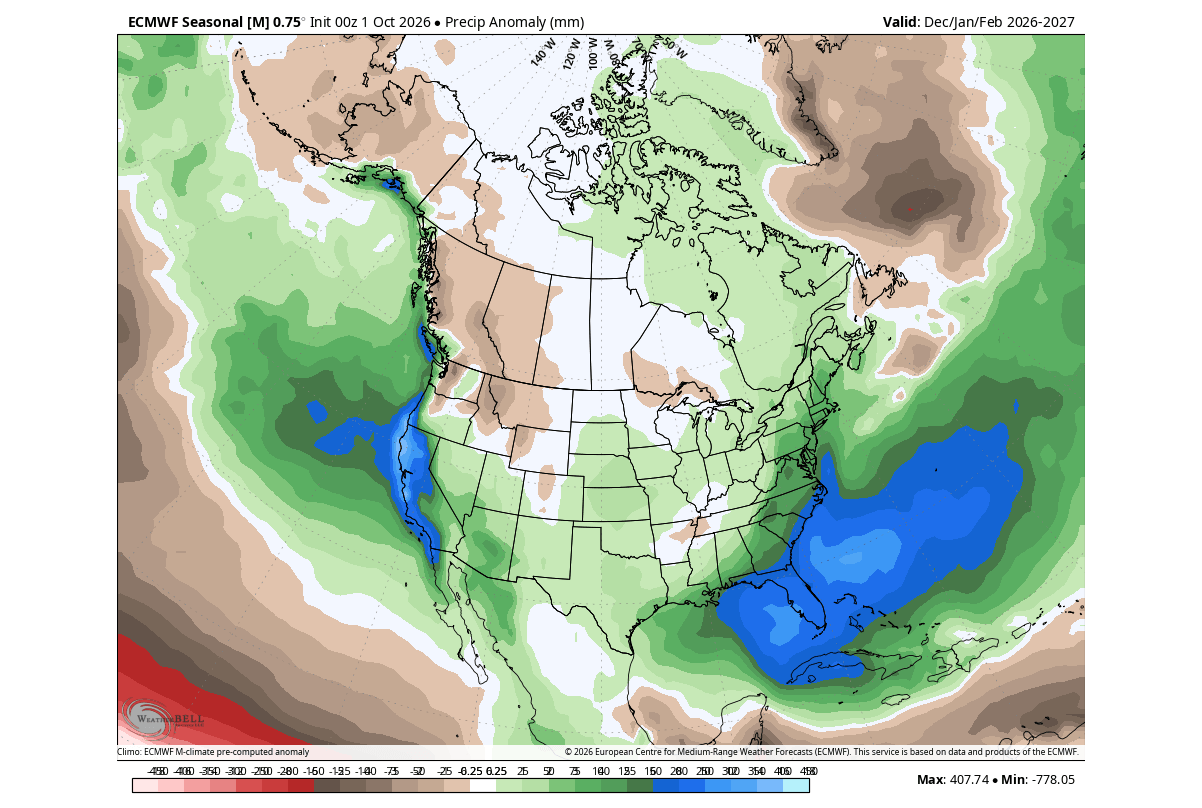
Reflecting this amplified pattern, the temperature forecast hastrended colder for the southern United States, driven by persistent cloud cover and storm activity. Conversely, above-normal temperatures remain locked in across western Canada, the northern plains, the U.S. West Coast, and the Northeast. In terms of precipitation, the signature El Niño signal is robust, projecting above-normal moisture across California, the Southwest, the Southeast, and the Mid-Atlantic.
Official Responses and Scientific Consensus
Global meteorological authorities, including the World Meteorological Organization (WMO) and the U.S. Climate Prediction Center (CPC), have emphasized the elevated risks of extreme weather associated with the 2026/2027 setup.
Speaking on the global implications of the event, WMO climatologists noted that the unprecedented velocity of sea surface temperature increases in the central and eastern Pacific requires heightened preparedness across civil infrastructure, emergency management, and agricultural sectors. Because Super El Niños fundamentally alter the baseline state of the global atmosphere, authorities are urging local jurisdictions in high-risk zones—particularly along the active southern U.S. storm track—to prepare for potential infrastructure stress from heavy precipitation, localized flooding, and disruptive ice or snow events.
Furthermore, atmospheric scientists are closely monitoring the upper atmosphere for teleconnections linked to the stratospheric Polar Vortex.
Implications: A Backloaded Winter and the Polar Vortex Wildcard
While the early-season outlook points to a milder start across the northern tier and active storm conditions in the south, the long-range implications for mid-to-late winter introduce a critical wildcard: the stratospheric Polar Vortex.
The Mid-Winter Disruption Signal
The Polar Vortex acts as a vast circumpolar containment wall of high-altitude westerly winds that traps frigid air over the polar cap. The latest ECMWF seasonal diagnostics indicate an unusual and pronounced weakening of these stratospheric winds beginning in late December and extending deeper into January and February. When zonal winds decelerate significantly below the long-term climatological average, the stability of the vortex is compromised.
Research into past Super El Niño events—including detailed analyses of the 2015/2016 winter—reveals a tendency for robust early-season vortex behavior to give way to rapid mid-winter destabilization. This occurs when intense atmospheric wave energy, driven upward from the warm Pacific, exerts mechanical pressure on the stratosphere.
CFSv2 and CanSIPS Consensus on February Amplification
Supporting the ECMWF signals, long-range forecasts from the Canadian CanSIPS model and the NOAA CFSv2 system point toward a major pattern amplification by February. Both models agree on the persistence of a strong blocking high-pressure center over Canada, which in turn forces a sprawling, deep-tropospheric low-pressure anomaly across the central and eastern United States.
The resulting February temperature projections from these secondary models depict a broad expanse of below-normal temperatures stretching from the Southwest through the Ohio Valley and into the Southeast. This alignment significantly elevates the probability of a "backloaded" winter—one where the harshest cold air outbreaks and highest-impact winter storms are deferred to the second half of the season.
Regional Breakdown and Key Takeaways
- Northern U.S. and Southern Canada: Expect a predominantly mild season under persistent high pressure. Snowfall totals are projected to run below normal across the Pacific Northwest, the Upper Great Lakes, and coastal sections of the Northeast and Maritime Canada.
- Southern and Central U.S.: An active southern jet stream guarantees a stormy winter characterized by above-average precipitation and trending colder temperatures. The Central Plains, Midwest, Ohio Valley, and Southern Appalachians carry heightened risks for disruptive snow and ice events, particularly moving into February.
- Western Ski Resorts: The strongest winter sports snowfall signal is heavily concentrated over the Sierra Nevada in California, with solid, above-normal snowpacks also favored across the Great Basin, Utah, the Southern Rockies, and the high elevations of Arizona and New Mexico.
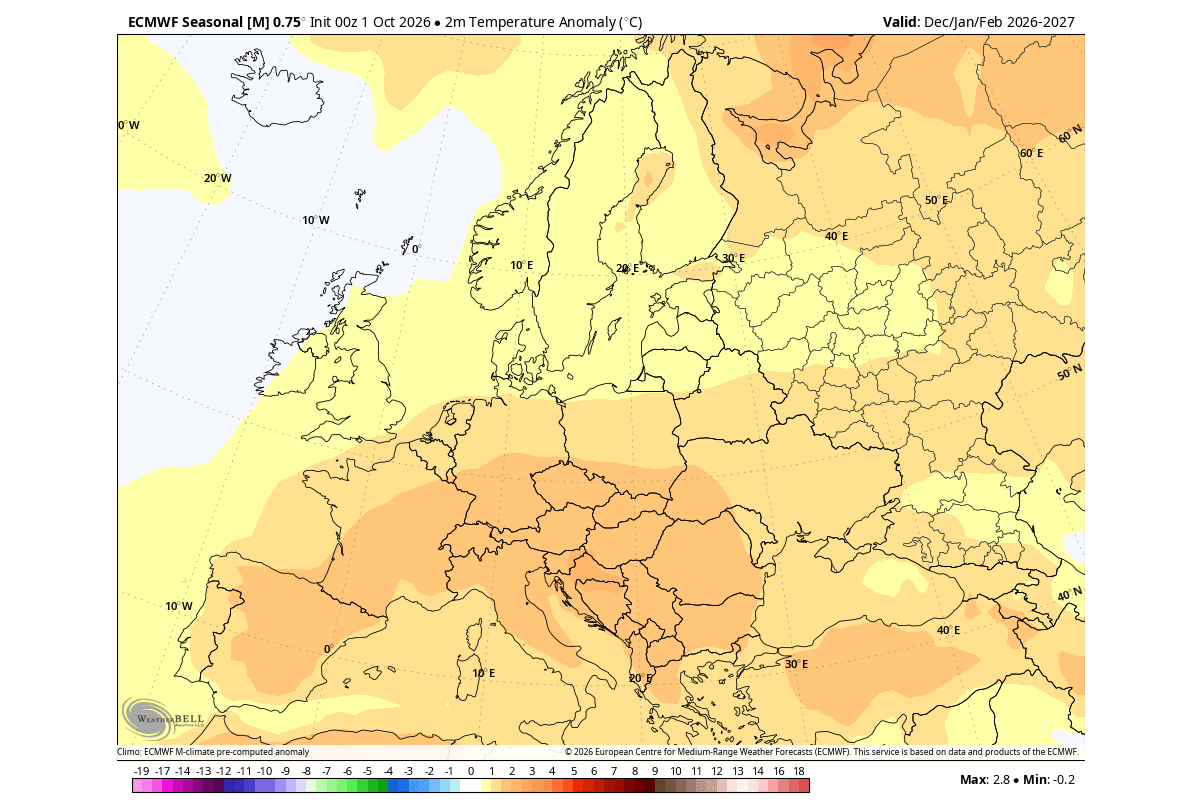
- Europe: Governed by a dominant westerly and southwesterly flow from the Atlantic, the European continent is forecast to experience a predominantly mild winter. While precipitation will run above normal, natural snow cover will likely be restricted to higher elevations (typically above 1,800 to 2,000 meters) in the Alps and across far northern latitudes.
- The Polar Vortex Factor: A projected mid-winter weakening of the stratospheric vortex increases the risk of cold-air outbreaks penetrating the mid-latitudes, serving as the primary catalyst for a volatile, high-impact finish to the 2026/2027 winter campaign.
