

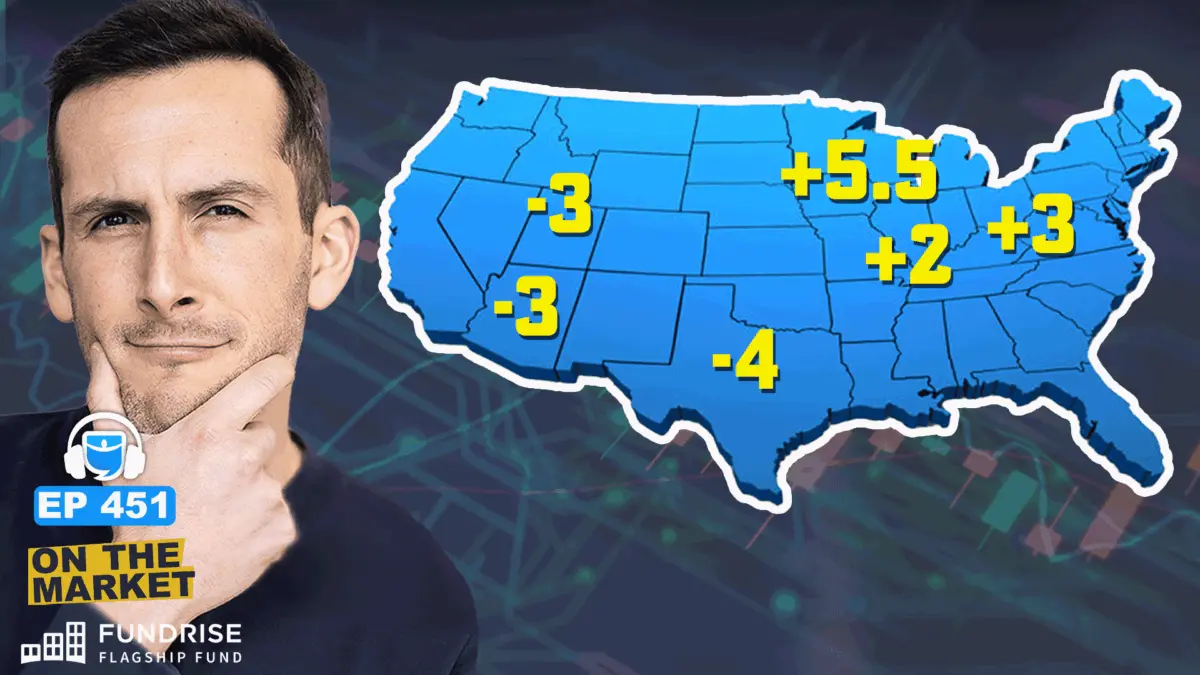
National headlines paint a concerning picture for real estate investors: year-over-year rent prices are down across the United States. However, looking strictly at national averages masks a complex, highly localized economic reality. While certain markets are experiencing steep corrections, others are quietly posting stable rent increases of 3% to 5%.
Understanding the underlying mechanics of these regional divergences is critical for protecting current cash flow and underwriting future acquisitions. Recently on the On the Market podcast, host Dave Meyer broke down the latest rental market data, exploring the stark divide between single-family and multifamily assets, the looming threat of tenant affordability ceilings, and a step-by-step framework investors can use to forecast rents in their local markets.
Main Facts: The National Rental Landscape
On a national level, the rental market is experiencing a mild correction often described as a "rent recession." According to recent data from Apartment List, national rents ticked up a modest 0.4% sequentially during the spring—a normal seasonal bump—but remained down 1.2% year-over-year.
This sideways-to-negative momentum has persisted since mid-2023. More importantly, national rent growth is currently lagging behind general inflation. While inflation has hovered around 3% to 4%, average rents have stagnated or grown by only 1% to 1.5%. Consequently, property owners and landlords are experiencing a net loss in real purchasing power.
However, a closer look at the data reveals that "the national average" is being dragged down heavily by the multifamily sector. Meanwhile, single-family rentals (SFRs) continue to show resilience, posting modest positive year-over-year growth.
Chronology of the Shift: From Pandemic Boom to Oversupply
To understand where rents are heading through 2026 and 2027, it helps to examine how the market reached this juncture over the past several years:
- 2020–2022 (The Boom Years): Fueled by low interest rates, migration to the Sunbelt, and immense housing demand, rents surged by historic margins of 10%, 15%, and even 20% annually. Developers responded aggressively by financing and building massive waves of new multifamily inventory.
- 2023 (The Delivery Glut Begins): Because large multifamily projects typically take two to three years to build, the units greenlit during the pandemic boom began hitting the market in earnest by 2023. This wave of new supply—known in the industry as "deliveries"—began cooling rent growth significantly.
- 2024–2025 (The Affordability Ceiling): Rent growth turned flat or negative nationally. Wage growth failed to keep pace with the cumulative rent spikes of the early 2020s, pushing average American renters past the traditional "cost-burdened" threshold.
- 2026–2027 (The Current Correction and Forecast): Elevated deliveries continue to hit certain markets, keeping rents suppressed in overbuilt regions. However, market-rate supply pipelines are projected to normalize by 2028, setting the stage for eventual stabilization.
Supporting Data: Single-Family vs. Multifamily Realities
Not all rental asset classes are created equal. The divergence between single-family homes and large multifamily apartments explains why some investors are thriving while others are cutting rates.
Single-Family Rentals (SFRs)
According to the CoreLogic Single-Family Rental Index, SFR prices are up roughly 1.4% year-over-year. Because single-family housing has not faced the same massive oversupply issues as apartments, it avoided nominal price drops.
However, SFR growth remains far below its historical 3% to 4% annual average. Furthermore, a K-shaped dynamic has emerged within the SFR space:
- High-End SFRs: Experiencing healthier growth (around 2.1%), as higher-income tenants possess greater flexibility to absorb housing costs relative to their overall budgets.
- Low-End SFRs: Barely moving, showing just 0.6% growth due to strict affordability constraints at the bottom of the market.
Multifamily Properties
The multifamily sector has endured three consecutive years of nominal losses (averaging 1% to 2% declines annually, equating to a cumulative 5% to 7% drop in many regions). This decline is directly tied to the aforementioned delivery glut. Consequently, national multifamily occupancy rates have slipped to roughly 94%—their lowest level since 2013.
Official Responses and Economic Pressures: The Twin Drivers of Supply and Affordability
Two primary variables are driving the current state of rental markets: supply and affordability.
1. The Supply Glut
While economists frequently note a long-term national housing shortage, the short-term reality is localized oversupply. Cities in the Sunbelt—such as Austin, Phoenix, Atlanta, Charlotte, Orlando, and Dallas—saw developers build at an unsustainable pace. For instance, Phoenix is projected to add 4% to 5% more housing stock to its total inventory within a two-year window. Absorbing this volume of new deliveries requires time, leading property managers to lean heavily on concessions, discounts, and lower base rents to keep units filled.
2. The Affordability Speed Limit
Rent prices cannot indefinitely outrun local incomes. According to Department of Housing and Urban Development (HUD) data, the average American currently spends 33% of their income on rent, crossing the traditional 30% threshold that defines a "cost-burdened" household.
When rents become constrained by low affordability, three mechanical shifts occur in the market:
- Tenant Resistance: Renters choose to move rather than accept aggressive hikes.
- Market Downgrading: Tenants opt for lower-end units rather than stretching into luxury apartments.
- Suppressed Household Formation: Stressed affordability forces young adults to delay moving out of their parents’ homes or pushes roommates to double up, directly reducing aggregate housing demand.
Implications for Real Estate Investors
For active investors, the current market climate requires a strategic shift in portfolio management and underwriting. Simply banking on uniform 4% annual rent increases is no longer viable.
Regional Winners and Losers
- The Over-Supplied Markets (Downward Pressure): Cities like Austin (-4%), Phoenix (-3%), Denver (-3%), San Antonio, Nashville, and Charlotte will likely see suppressed rents through late 2027 as remaining multifamily pipelines clear. In these areas, falling multifamily rents can also exert a gravitational pull on single-family rentals due to increased competition from leasing concessions.
- The Supply-Constrained & Affordable Markets (Outperformers): The Midwest and Rust Belt—including Chicago, Milwaukee, Philadelphia, Detroit, and Indianapolis—continue to post solid growth (ranging from 2% to 5.5%). These markets feature tight inventory, strong local economies, and rent-to-income ratios well below the 30% ceiling, giving them significant "room to run."
A Practical Forecasting Framework for Investors
Rather than relying on generalized national data, real estate investors should evaluate their local markets using a simple three-step framework:
- Analyze Short-Term Supply (Next 1–2 Years): Consult local housing reports or AI tools to determine how much new supply is coming online relative to existing housing stock. If a metro area is adding 3% to 5% new stock annually, expect flat or negative rent growth regardless of overall affordability.
- Calculate the Rent-to-Income Ratio (Medium Term, 3–5 Years): Compare the local median household income to the median rent. If the ratio sits comfortably below 30% (as seen in cities like Chicago or Detroit), the market possesses strong capacity for future rent expansion once current economic headwinds clear.
- Evaluate Job and Wage Growth (Long-Term Fundamentals): Over a 5- to 10-year horizon, sustainable rent growth requires matching wage growth. Focus investments on MSAs with robust job creation, which naturally drives the income gains necessary to support healthy, inflation-matching rental revenues.
By carefully auditing local supply pipelines and affordability metrics, real estate investors can accurately forecast rent trajectories, optimize their existing portfolios, and underwrite new opportunities with confidence.
