

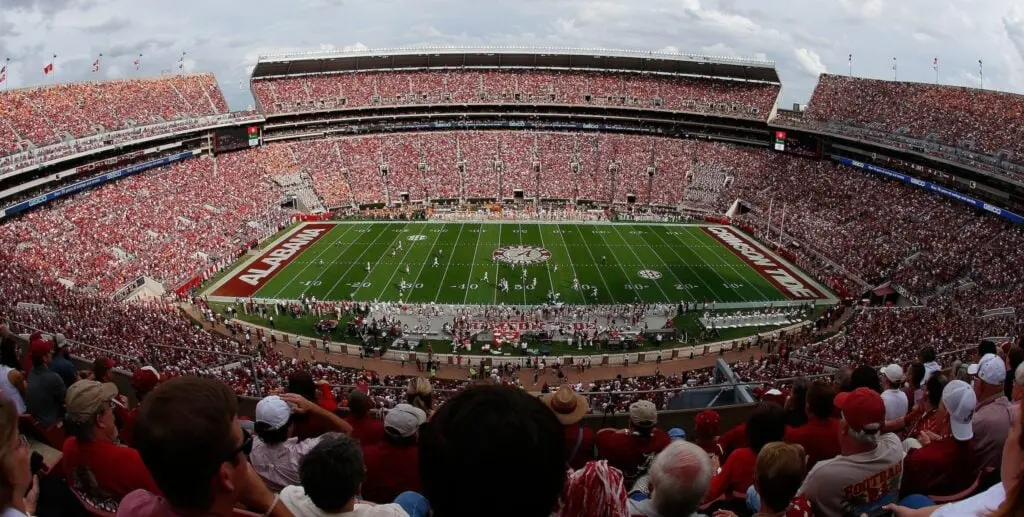
As the late-summer heat lingers and fans nationwide begin passionately debating roster depth and backup quarterbacks, an entirely different kind of preparation is underway behind the scenes. Across the American college football landscape, approximately 100,000 screaming fans are preparing to descend upon university towns every autumn weekend, packing into aluminum bleachers and transforming quiet local economies into high-yield tourism hubs.
For real estate investors, college football season represents one of the most reliable, localized revenue spikes in the short-term rental (STR) sector. During these six or seven crisp autumn Saturdays, nightly rates in select university markets surge to levels that would be unimaginable during the slow heat of June or July.
However, translating a storied athletic program into a profitable real estate investment requires far more than blind school spirit. A rigorous analysis of AirDNA market metrics and trailing-12-month data through July 2026—paired with exhaustive reviews of local municipal zoning ordinances—reveals that the most successful college real estate markets require a delicate balance of robust year-round local economies, favorable property tax structures, and navigable municipal regulations.
Main Facts: The Intersection of College Football and Short-Term Rentals
The allure of college football investing is undeniable: a guaranteed calendar of high-demand weekends where nightly rates can double or triple overnight. Yet, a deep dive into the data reveals that football is primarily a rate event, rather than a volume event.
Across the analyzed collegiate markets, annual occupancy rates rarely experience a massive autumn surge; instead, profitability is driven by capitalizing on a handful of high-value weekend spikes. Cities that rely solely on football often sit as ghost towns from February through August, destroying annual yield. The truly successful markets maintain a diversified economic base—such as major hospital systems, state capitals, tech hubs, or robust convention calendars—that cushions the investment during the off-season.
Furthermore, municipal regulatory frameworks act as the ultimate gatekeeper for investors. The markets with the highest football-rate premiums are frequently the very same municipalities that have enacted aggressive permitting caps, night limits, or outright bans on non-owner-occupied short-term rentals.
Chronology: Methodology and Data Sourcing
To establish this ranking, researchers initiated a comprehensive screening process starting with the home markets of the top 50 NCAA football programs.
- The Initial Filter (Metros and Thin Markets): Programs located within major metropolitan areas (such as Los Angeles or Atlanta) were eliminated immediately. In a sprawling metro of 2 million people, a 100,000-seat stadium completely disappears into the economic noise, yielding minimal impact on local housing yields. Similarly, markets with insufficient transaction data to read a reliable rate curve were cut. Ultimately, 22 municipal markets advanced to full evaluation.
- The Scoring Metrics: Each finalist market was evaluated across core quantitative indicators: trailing revenue, Average Daily Rate (ADR), occupancy, active supply, and home values via the Zillow Home Value Index (ZHVI) pulled in August 2026. Preseason poll and recruiting rankings were factored in purely as forward-looking tiebreakers.
- The Regulatory Audit: In August 2026, researchers conducted a secondary screening phase—spending hours combing through complex municipal zoning codes, zoning overlays, and state-level preemption statutes. Any market experiencing a trailing revenue decline of greater than 5% or featuring insurmountable remote-investor bans was immediately disqualified.
Supporting Data: The Top 10 College Real Estate Markets
While storied programs like Penn State (State College, PA) posted massive gross revenues ($46,825), stringent local regulations—such as owner-occupancy mandates or strict night caps—pushed them out of the official top tier. Below are the definitive top 10 college real estate markets for 2026 based on yield, regulatory viability, and economic resilience.
10. Columbus, OH (Ohio State Buckeyes)
- Why it works: Boasting the highest occupancy rate in the study (62% on homes under $250,000), Columbus succeeds because its economy extends far beyond Saturdays. As home to Intel, Nationwide, massive medical networks, and a steady convention calendar, it books consistently in February while other college towns sit empty.
- Investor Angle: Despite Ohio State being a perennial national title contender, the market posts a modest 0.98x fall lift (football nights cost a hair less than summer peaks). Regulations are straightforward: an annual Department of Public Safety permit ($150 for investments), no night caps, local representation, and $300,000 in liability insurance.
9. Columbia, MO (Missouri Tigers)
- Why it works: Revenue climbed 15.6% over the trailing year while active listings dropped 2.7%, creating an ideal environment for existing operators. It is one of only three towns where fall revenue outright beats summer revenue.
- Investor Angle: City rules limit short-term rentals to eight occupants, allow only one license per owner, and require a conditional use permit for properties rented more than 120 nights annually (capped at 210). The smartest play is acquiring country land outside city limits or parcels in downtown mixed-use zones.
8. Columbia, SC (South Carolina Gamecocks)
- Why it works: Features the third-best revenue yield in the study, with a $230,662 median home generating $36,303 at 61% occupancy. Crucially, it produces steady income in non-football months like March.
- Investor Angle: Non-owner-occupied rentals are restricted to commercial, mixed-use, or major arterial/collector corridors. Investors must also navigate shifting municipal dynamics, including temporary residential STR permit moratoriums.
7. Norman, OK (Oklahoma Sooners)
- Why it works: Revenue rose 12.2% year-over-year on home values that remain accessible in the low-$200k range, supported by a tightly controlled active supply of just 558 listings.
- Investor Angle: Norman features one of the cleanest municipal codebooks for investors: clear licensing, no night caps, and reasonable lodging taxes (pending local ballot adjustments). September rates hit a healthy $226 compared to $172 in the summer.
6. Iowa City, IA (Iowa Hawkeyes)
- Why it works: The standout growth story of the study. Revenue surged 18.8% alongside a 12.4% jump in occupancy, all while active supply fell by 3.6%.
- Investor Angle: State-level preemption prevents Iowa City from banning, capping, or charging exorbitant STR-specific permit fees. Furthermore, secluded log cabins located 15 minutes outside the city limits consistently outperform properties within walking distance of Kinnick Stadium—a pattern repeated across multiple markets.
5. Lubbock, TX (Texas Tech Red Raiders)
- Why it works: Offering the lowest entry price on the list ($212,191 median home price generating $29,154), Lubbock delivers a strong 13.7% pre-tax yield.
- Investor Angle: Football is a secondary driver here; the highest-rate month of the year is actually May, driven by Texas Tech commencement ceremonies rather than gridiron events.
4. Athens, GA (Georgia Bulldogs)
- Why it works: Athens saw listings drop by 7.2% while operators raised rates by 17%. A solid 1.71x fall premium combined with a low 0.82% property tax rate supports overall financial performance.
- Investor Angle: Athens-Clarke County enforces strict zoning distinctions. Commercial short-term rentals require a Special Use Permit via a discretionary public commission hearing, making this a highly localized, address-specific market.
3. Oxford, MS (Ole Miss Rebels)
- Why it works: Oxford is arguably the most football-dependent market in America. It commands the highest ADR in the study ($438) despite a modest 33% annual occupancy. September rates soar to $611, generating over $41,700 annually on a house that sits empty two-thirds of the year.
- Investor Angle: The local Land Development Code does not explicitly classify non-owner-occupied whole-home STRs in its table of uses, requiring investors to secure a formal written determination from the Planning Director before closing.
2. Tuscaloosa, AL (Alabama Crimson Tide)
- Why it works: Fall nights average $513 compared to $252 in July—a massive 2.04x premium. Active inventory remains tightly constrained at just 525 listings.
- Investor Angle: The critical catch is a municipal restriction limiting residential STRs in Tourist Overlay areas to a maximum of 45 days per calendar year by right. Additionally, Alabama assesses rental properties at 20% of value (double the owner-occupied rate), doubling the effective property tax burden.
1. South Bend, IN (Notre Dame Fighting Irish)
- Why it works: South Bend decisively claimed the No. 1 spot, outperforming runners-up by 18 points. A typical home costs $202,170 and generates $39,546 in annual revenue. Home values appreciated by 6.9% year-over-year, and September rates run 82% above summer floors.
- Investor Angle: While a 46% occupancy rate might deter novice investors, six or seven weekends of high-rate bookings by fiercely loyal alumni drive the model. Compared to Ann Arbor, Michigan—where home values exceed $536,000 for nearly identical gross revenue—South Bend offers superior cash-flow fundamentals. Investors must factor in Indiana’s 2% non-homestead property tax cap.
Official Responses and Regulatory Implications
Municipalities across the country are increasingly grappling with the proliferation of short-term rentals in residential neighborhoods. The overarching trend identified in this study is clear: the market drivers that create high football-rate premiums are precisely the catalysts that trigger strict regulatory crackdowns.
When nightly rates skyrocket due to high-demand athletic programs, outside investors flood the local housing stock. This influx frequently displaces long-term residents, drives up local housing costs, and generates neighborhood friction regarding noise and parking. In response, city councils in college towns—such as Athens, Tuscaloosa, and State College—have routinely stepped in with tighter zoning overlays, discretionary public hearings, night-use caps, and owner-occupancy mandates.
Key Takeaways for Investors:
- Never rely on averages: County effective tax rates frequently underestimate non-homestead investment properties, which are often assessed at double the rate of primary residences.
- Verify before you buy: Remote investors must confirm zoning compliance, permit availability, and night limits directly with municipal planning offices in writing before going under contract.
- Look beyond the stadium: The most sustainable college real estate investments marry football-driven rate spikes with resilient, diversified local economies that generate stable revenue 12 months a year.
