

Every autumn, as temperatures begin to plummet across the Northern Hemisphere, a familiar narrative resurfaces across weather forums, meteorological blogs, and social media feeds: Is snow spreading rapidly across Siberia? For years, weather enthusiasts and long-range forecasters have pinned their hopes on a fast October snow advance in Eurasia, viewing it as an infallible early warning sign for a bitter, snowy winter across the United States, Canada, and Europe.
This widely accepted winter forecasting metric traces its roots back to a landmark 2011 scientific study. Ever since, it has been repeated like clockwork ahead of every cold season. However, with another rapid snow surge forecast for October, meteorologists have taken a closer look at the data. Analyzing 47 winters of historical data spanning from 1979 to 2025—utilizing four independent snow datasets, including the exact satellite metrics used in the original research—researchers have uncovered surprising results that challenge how we interpret pre-winter environmental signals.
Main Facts: Deconstructing the Eurasian Snow Theory
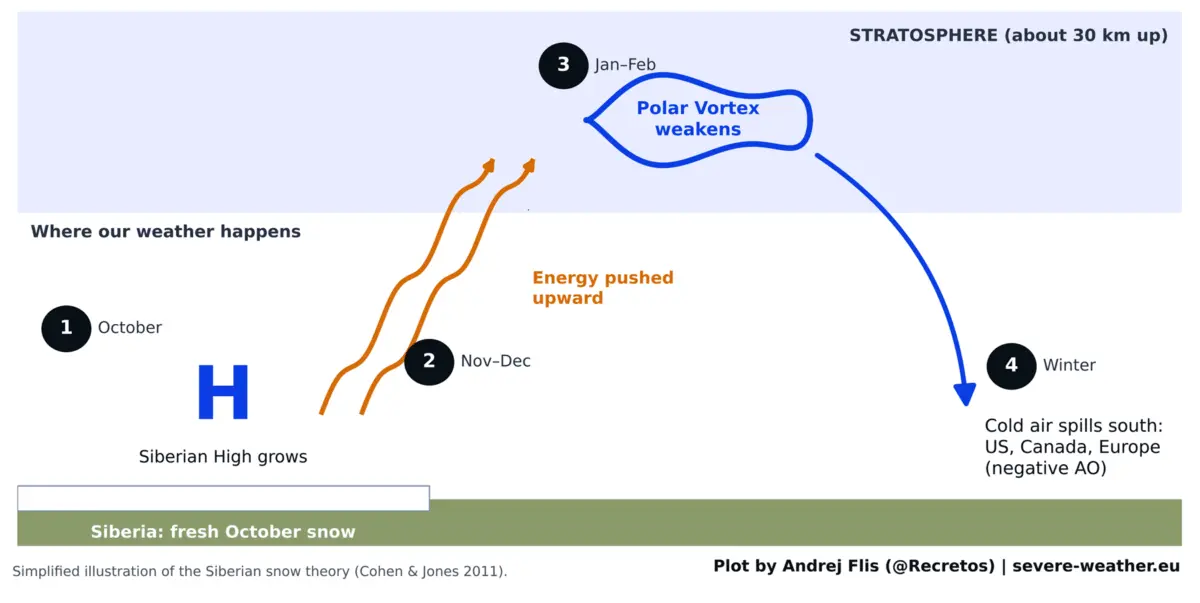
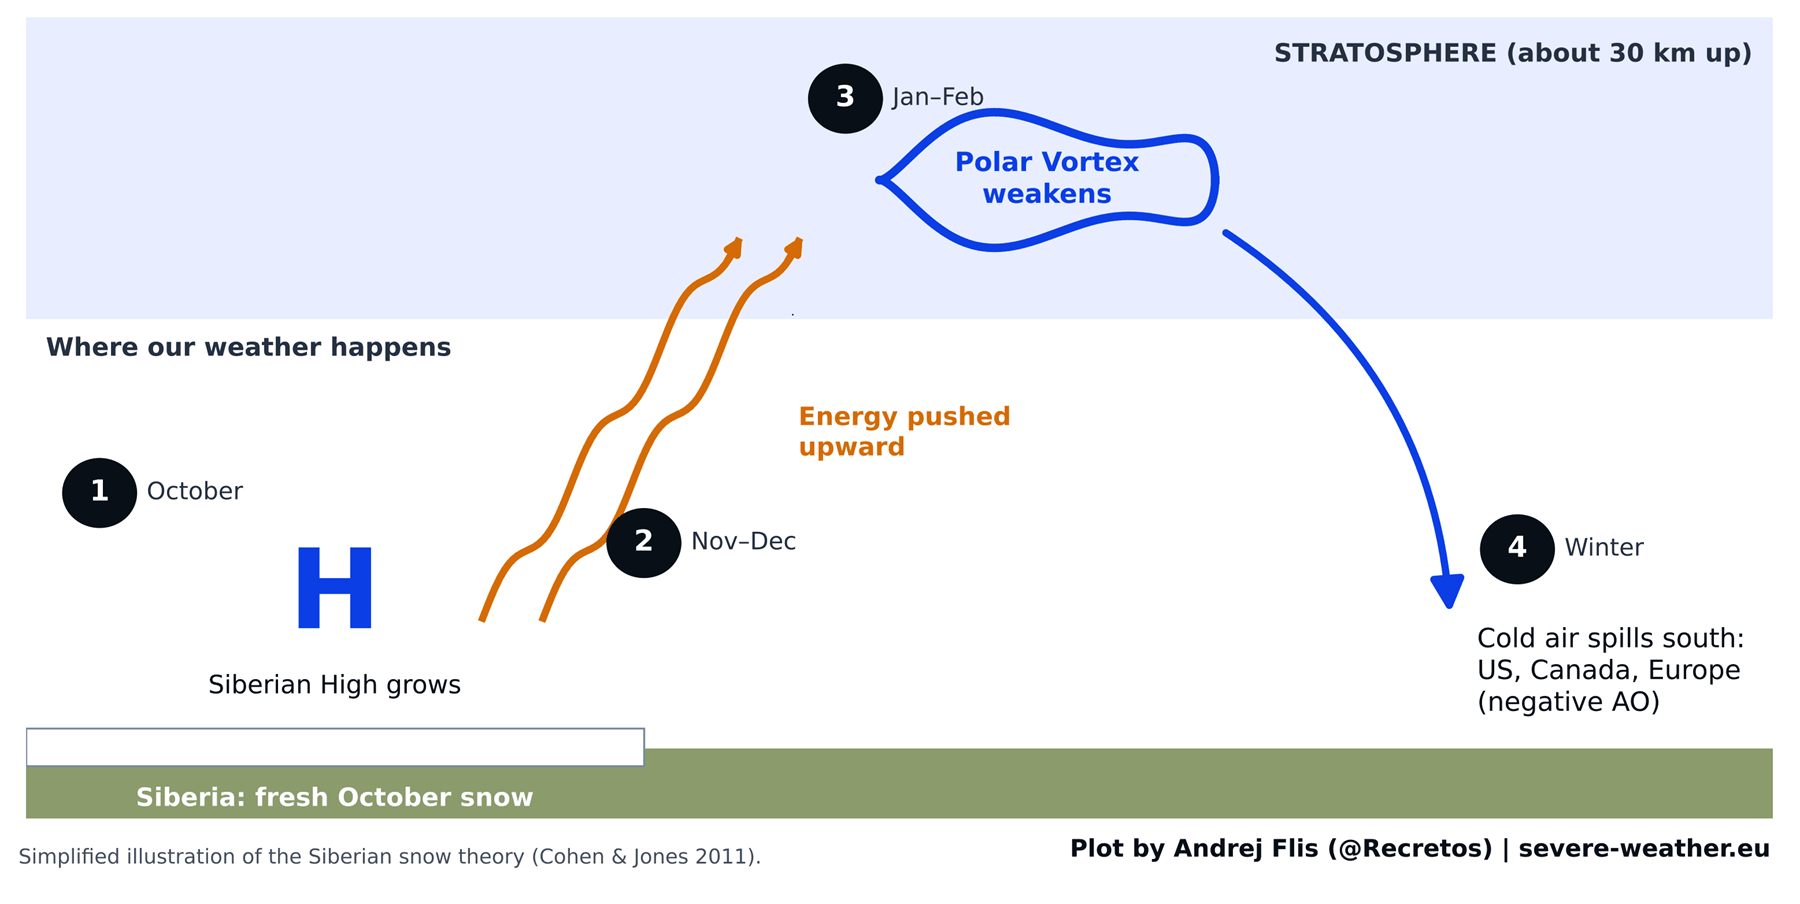
The concept that a snowy October in Eurasia portends a harsh winter is built upon a chain reaction linking surface conditions to the stratosphere.
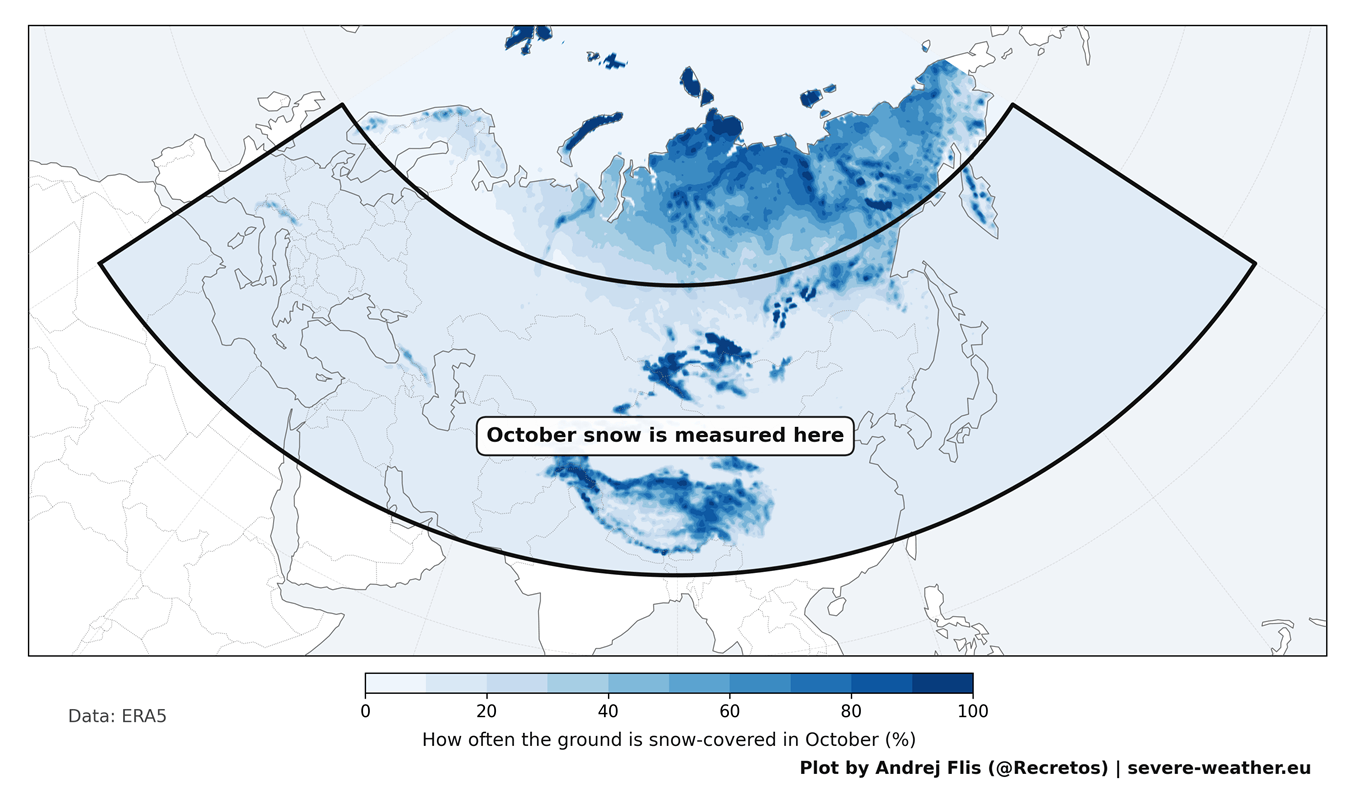
In 2011, scientists Judah Cohen and Justin Jones identified a compelling statistical correlation: the faster snow cover expanded across a massive swathe of Eurasia during October—stretching from Western Europe to the Pacific coast, encompassing southern Siberia, Mongolia, and the high-altitude terrain of Central Asia and Tibet—the higher the probability of severe, mid-latitude Arctic air outbreaks during the subsequent winter.
The physical mechanics behind the theory are sound in principle:
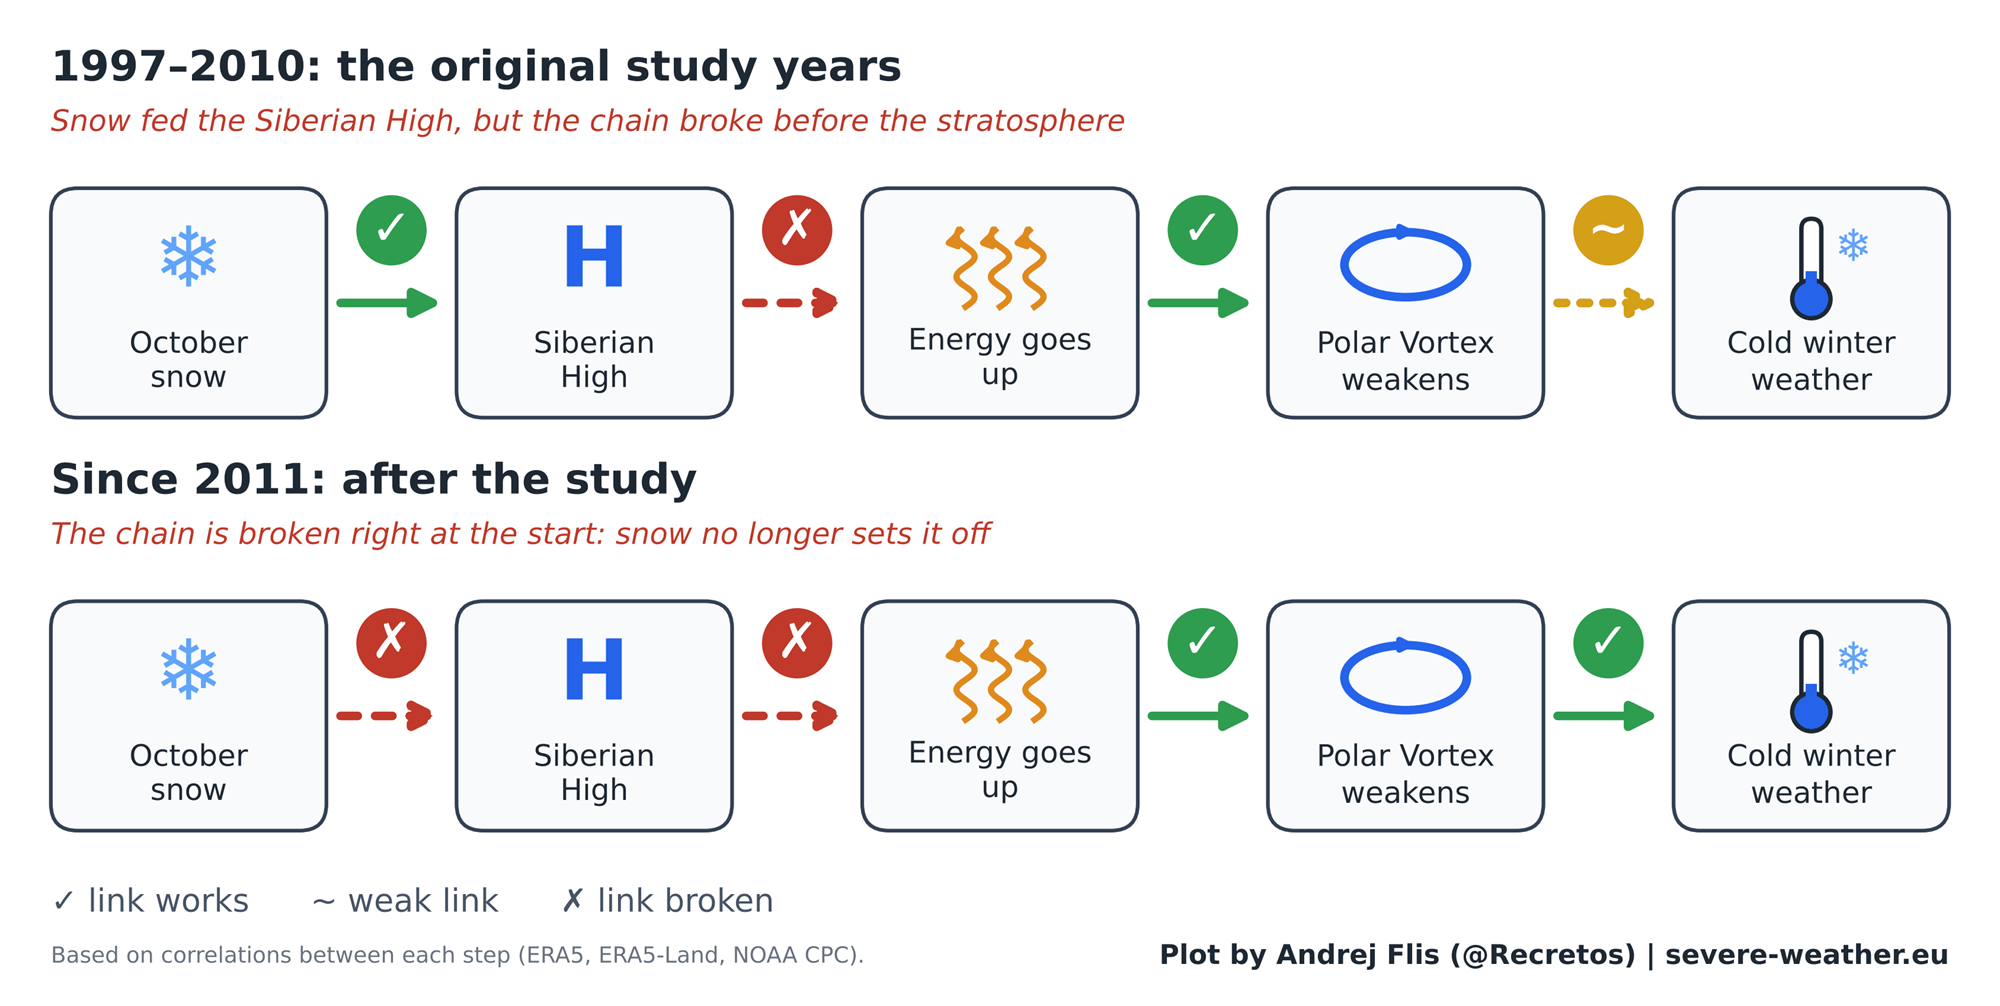
- Surface Cooling: Fresh snow cover rapidly cools the ground, intensifying the Siberian high-pressure zone—a massive pool of dense, cold air over northern Asia.
- Upward Energy Propagation: This strengthening high-pressure zone forces excess wave energy upward into the stratosphere, roughly 18.5 miles (30 km) above the Earth’s surface.
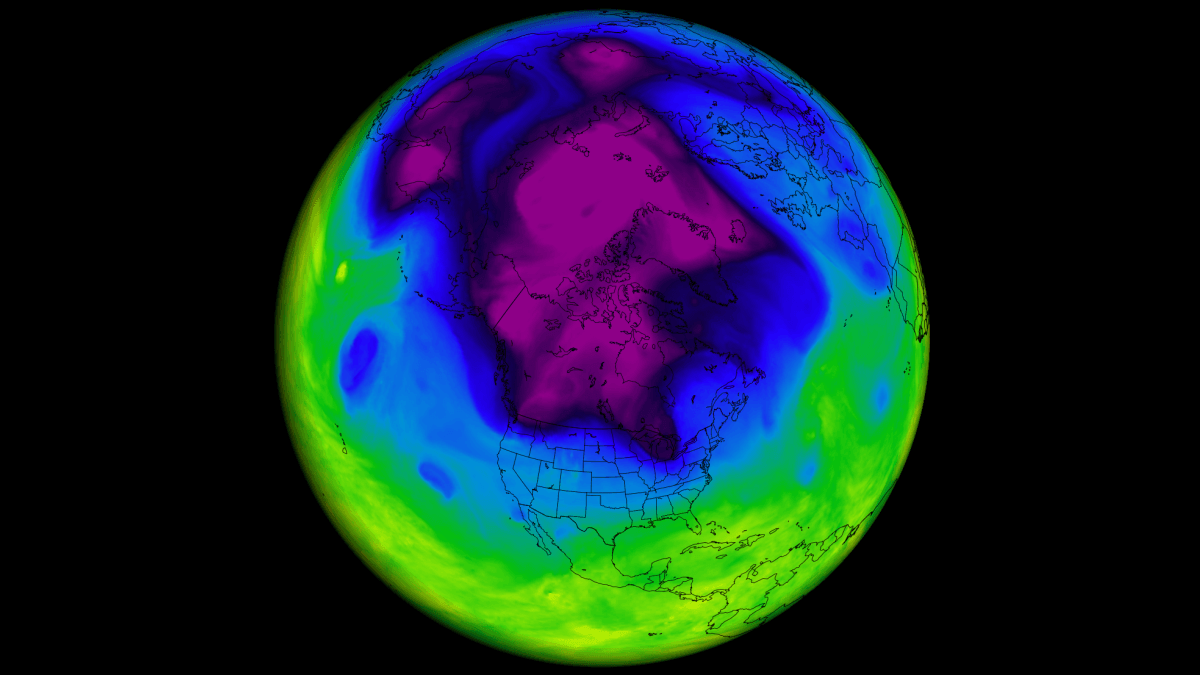
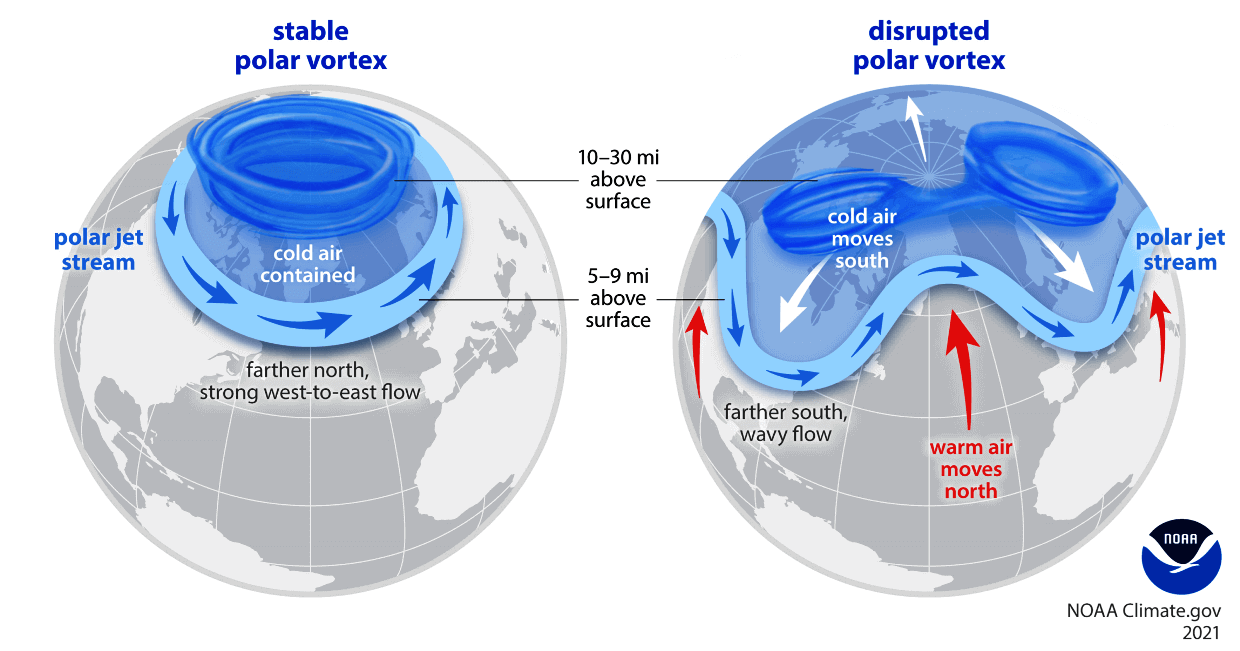
- Polar Vortex Disruption: The influx of energy disrupts the stratospheric Polar Vortex, a ring of westerly winds that normally locks the coldest Arctic air securely around the North Pole.
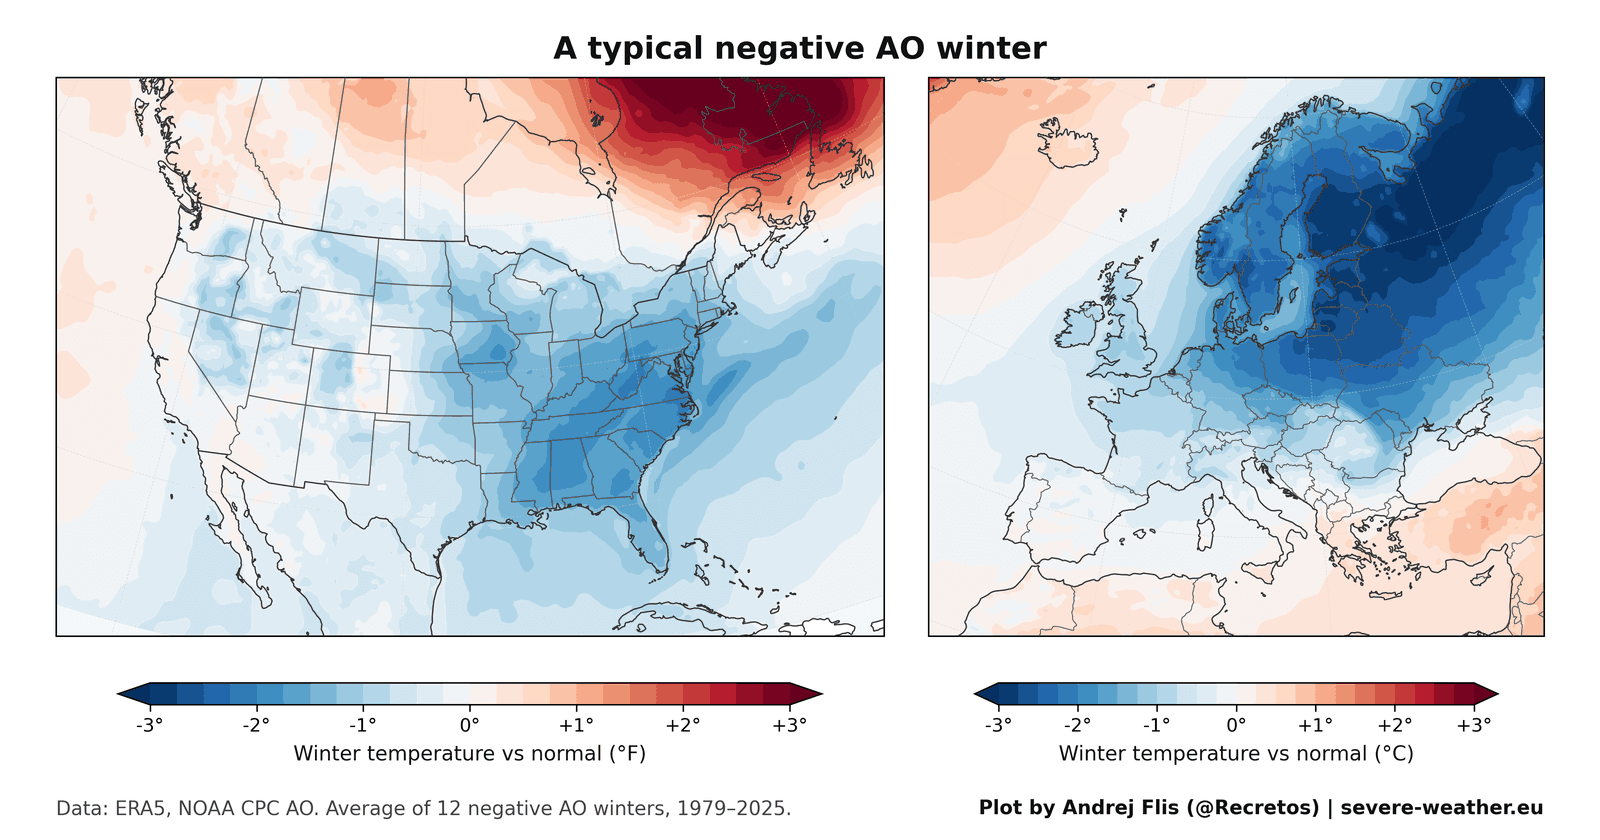
- The Negative Arctic Oscillation (AO): When the Polar Vortex weakens, stretches, or collapses, lobes of frigid air break free and spill southward into North America and Europe, driving the Arctic Oscillation into a negative phase.
While the atmospheric physics of a disrupted Polar Vortex are indisputable, recent empirical data suggests that the trigger—October Siberian snow cover—may no longer be the reliable catalyst it was once thought to be.
Chronology: The Rise, Peak, and Fading of the Snow Signal
The 2011 Breakthrough
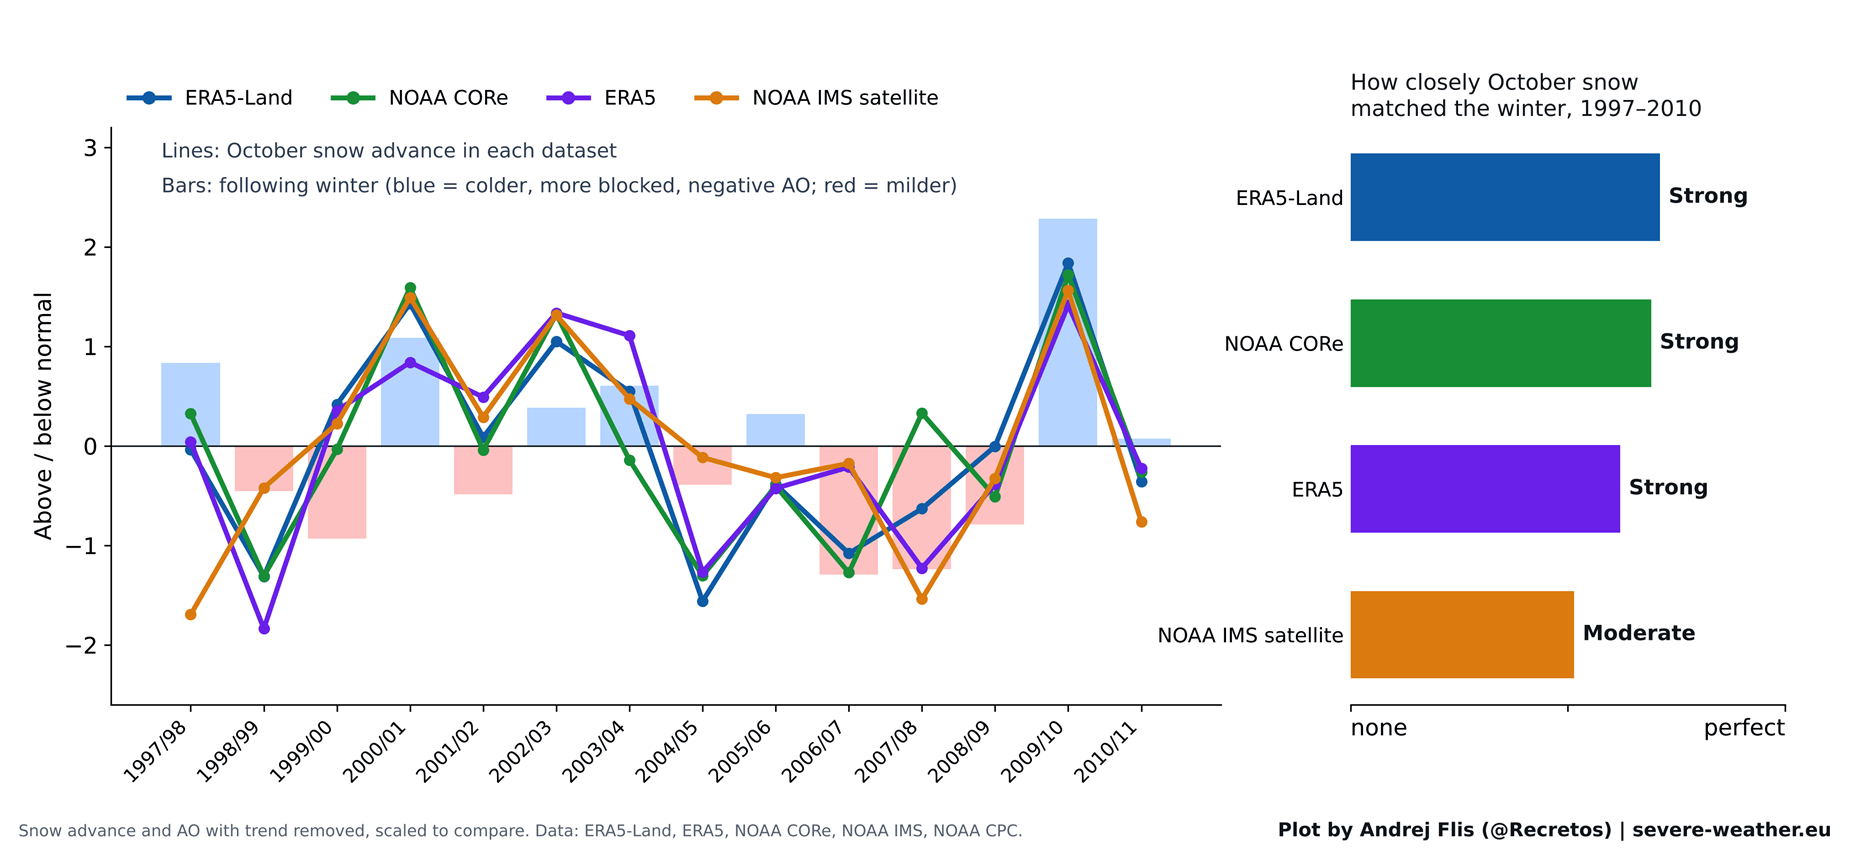
Between 1997 and 2010, the Siberian snow signal performed exceptionally well. It quickly became one of the most popular heuristic tools in long-range forecasting. However, the original study was constrained by available technology; daily satellite snow maps at the time only extended back to 1997, leaving the researchers with a baseline of just 14 winters.
The Modern Stress Test
To test the longevity of this theory, recent analyses evaluated 47 winters of data, crucially incorporating 15 new winter seasons recorded since the 2011 study was published.
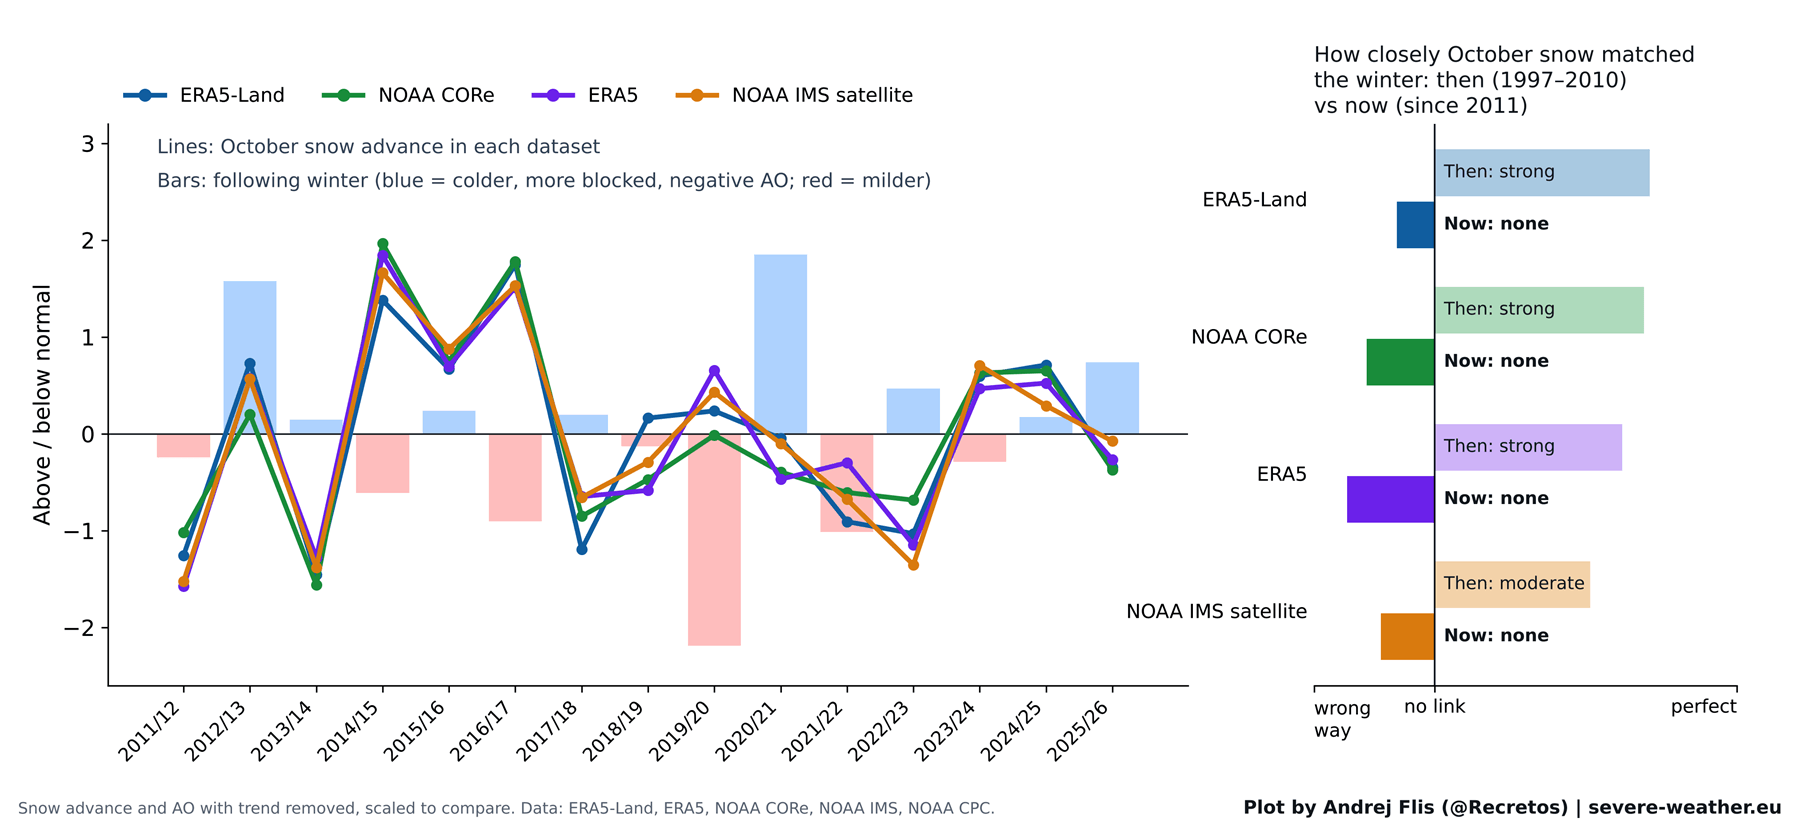
When researchers cross-referenced the historical data using four distinct snow datasets—ranging from satellite observations to modern weather reanalyses—the initial period (1997–2010) consistently verified the original findings. The correlation between October snow advance and the winter Arctic Oscillation was strong and statistically robust.
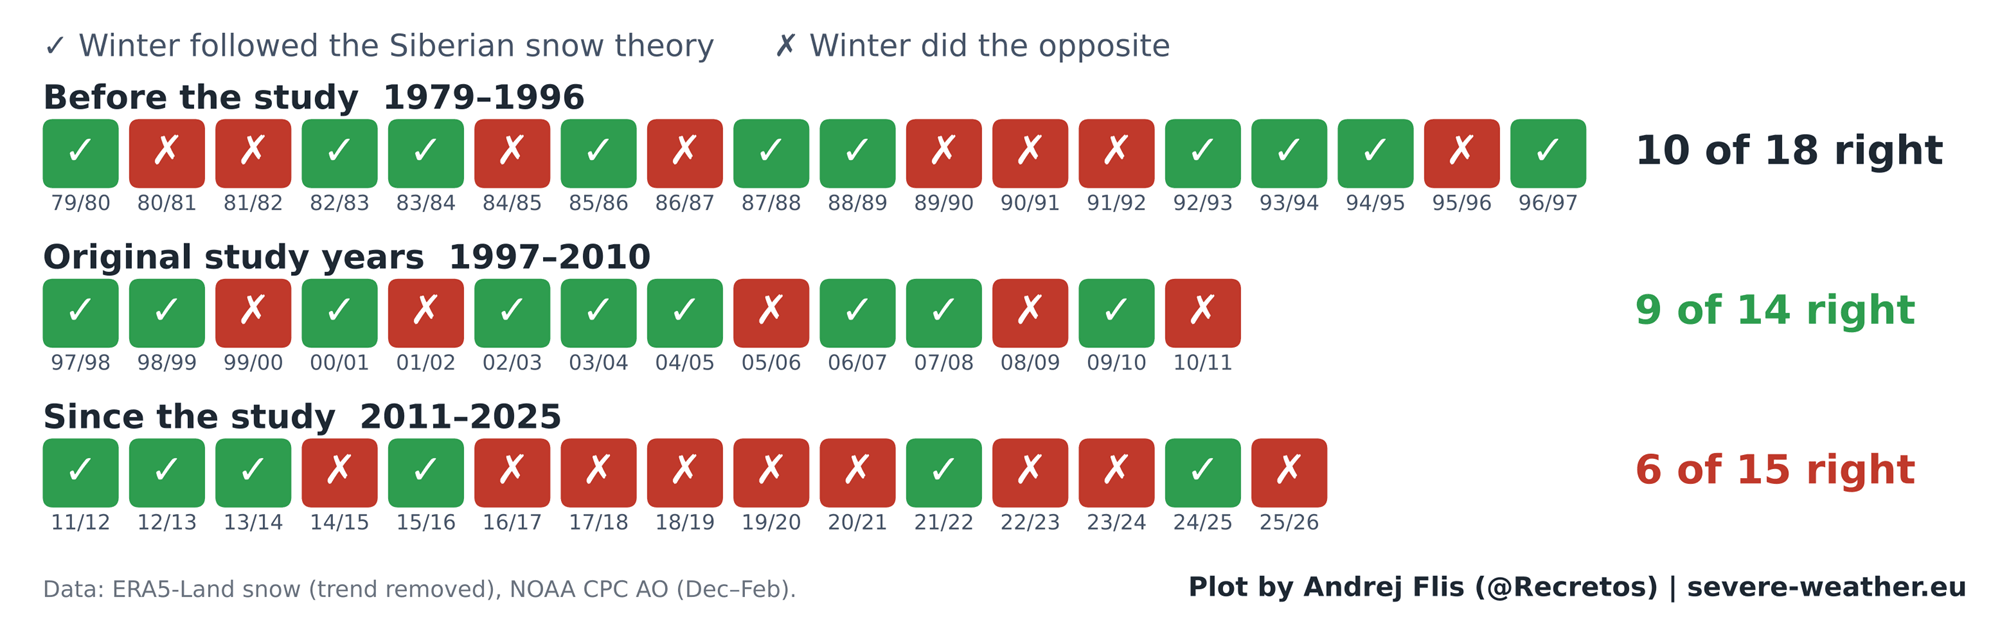
The Decoupling Post-2011
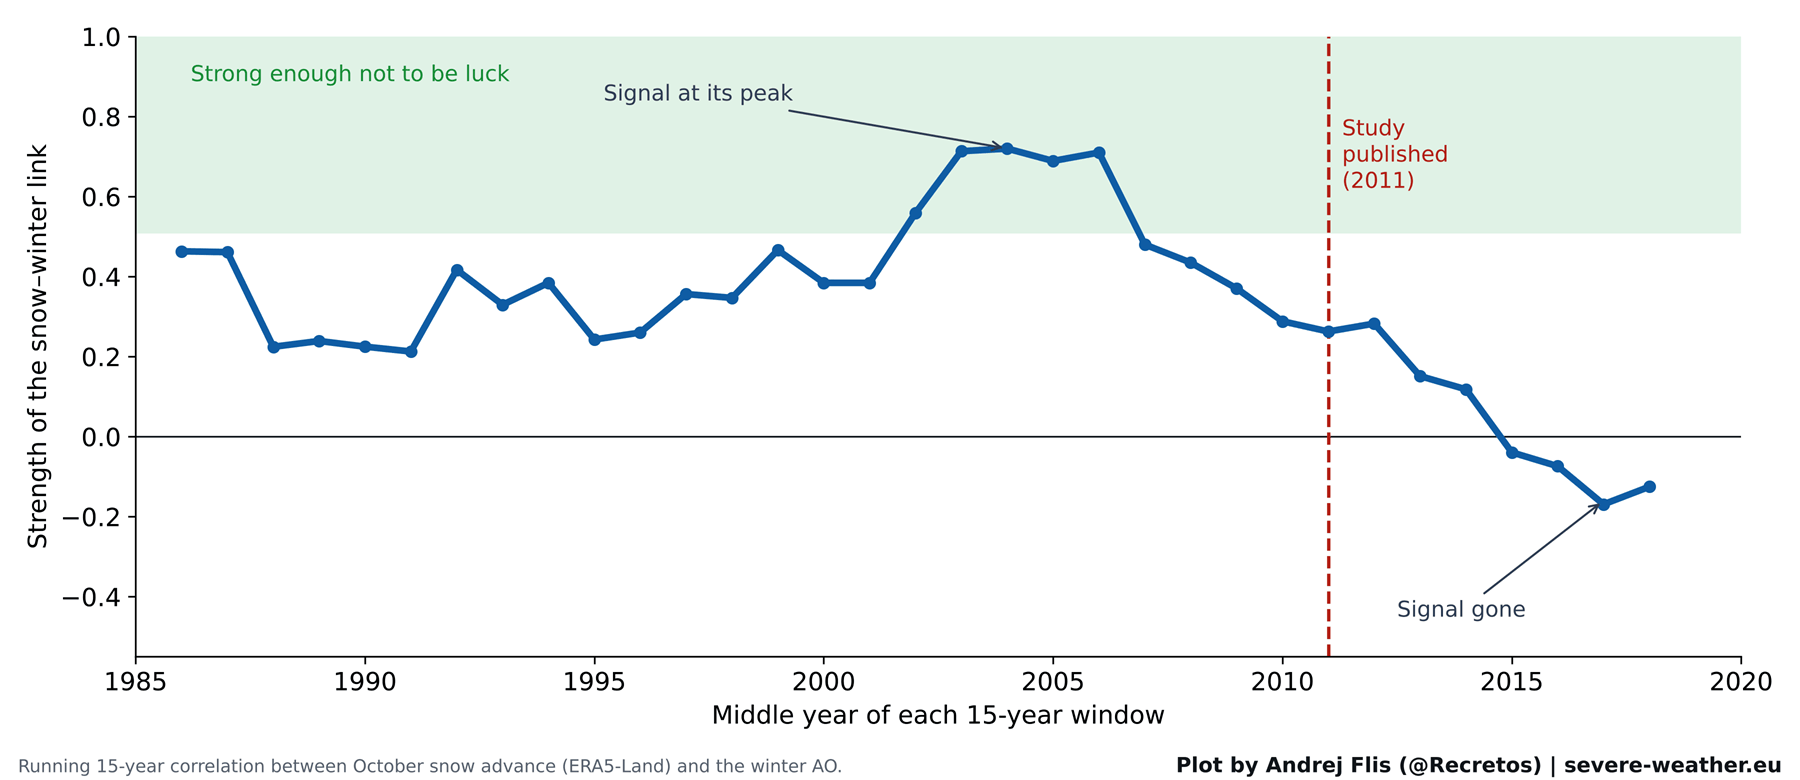
However, when tracking the signal’s strength over rolling 15-year windows, a distinct trend emerged: the predictive power of October snow peaked sharply in the mid-2000s, right around the time the study was being conducted. Since 2011, the signal has steadily degraded, eventually inverting into a negative correlation.
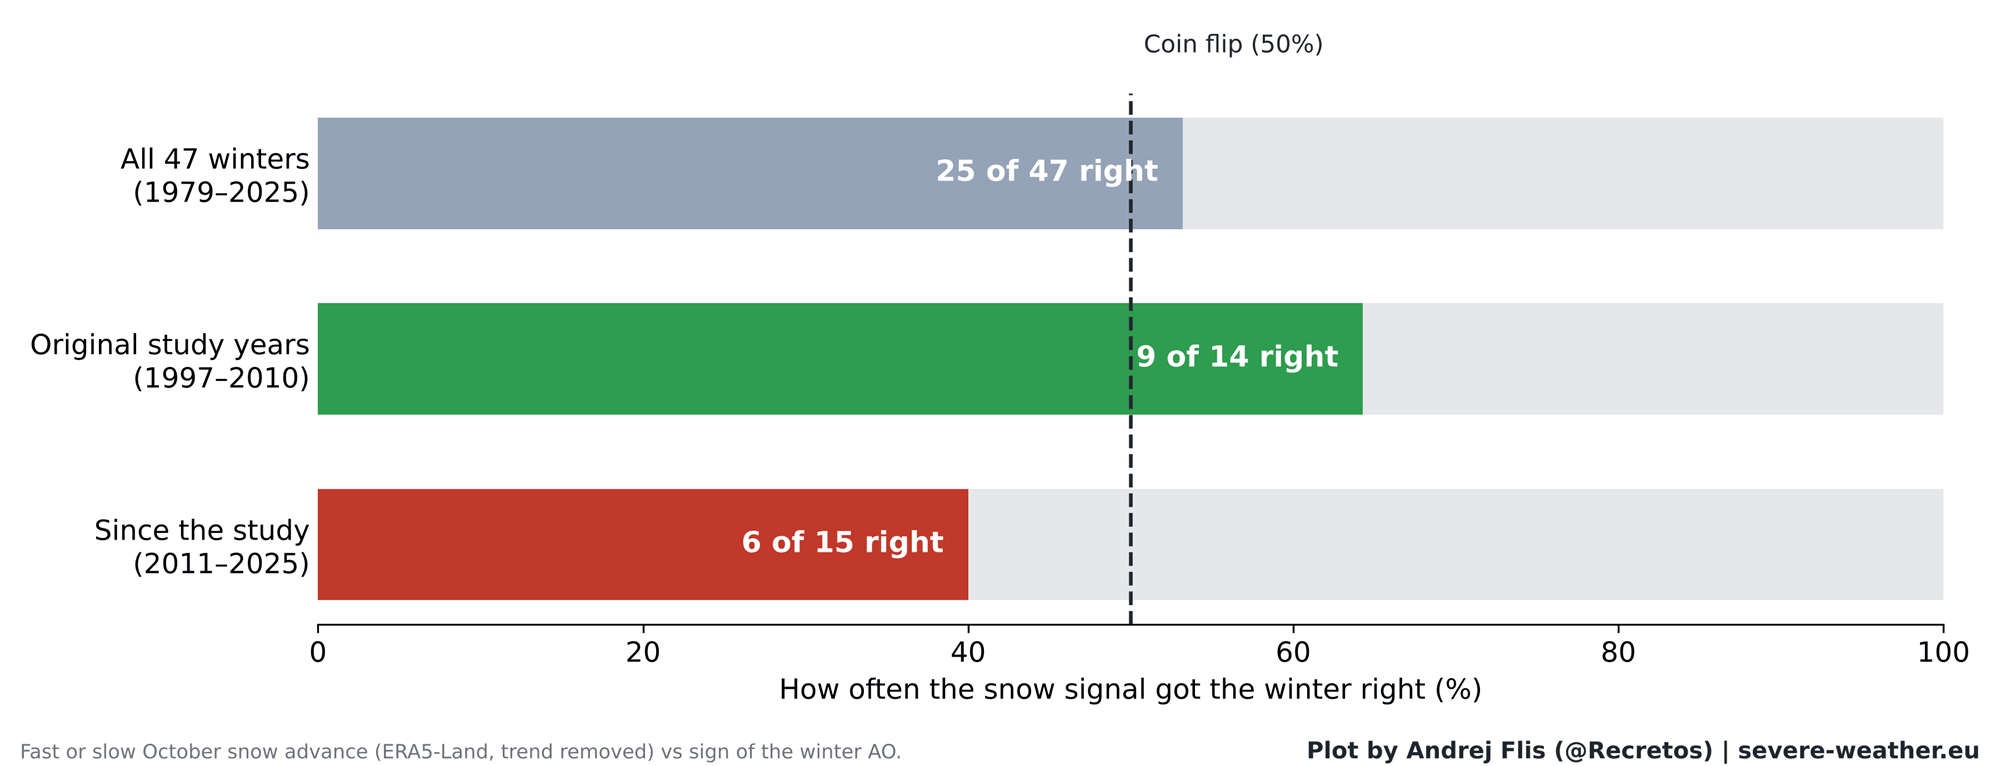
When evaluated across all 47 winters from 1979 to 2025, the snow signal successfully anticipated the correct winter regime 25 times and failed 22 times—essentially performing as a coin toss. Worse still, in the 15 winters following the 2011 publication, the index was accurate only 6 times, performing worse than random chance.
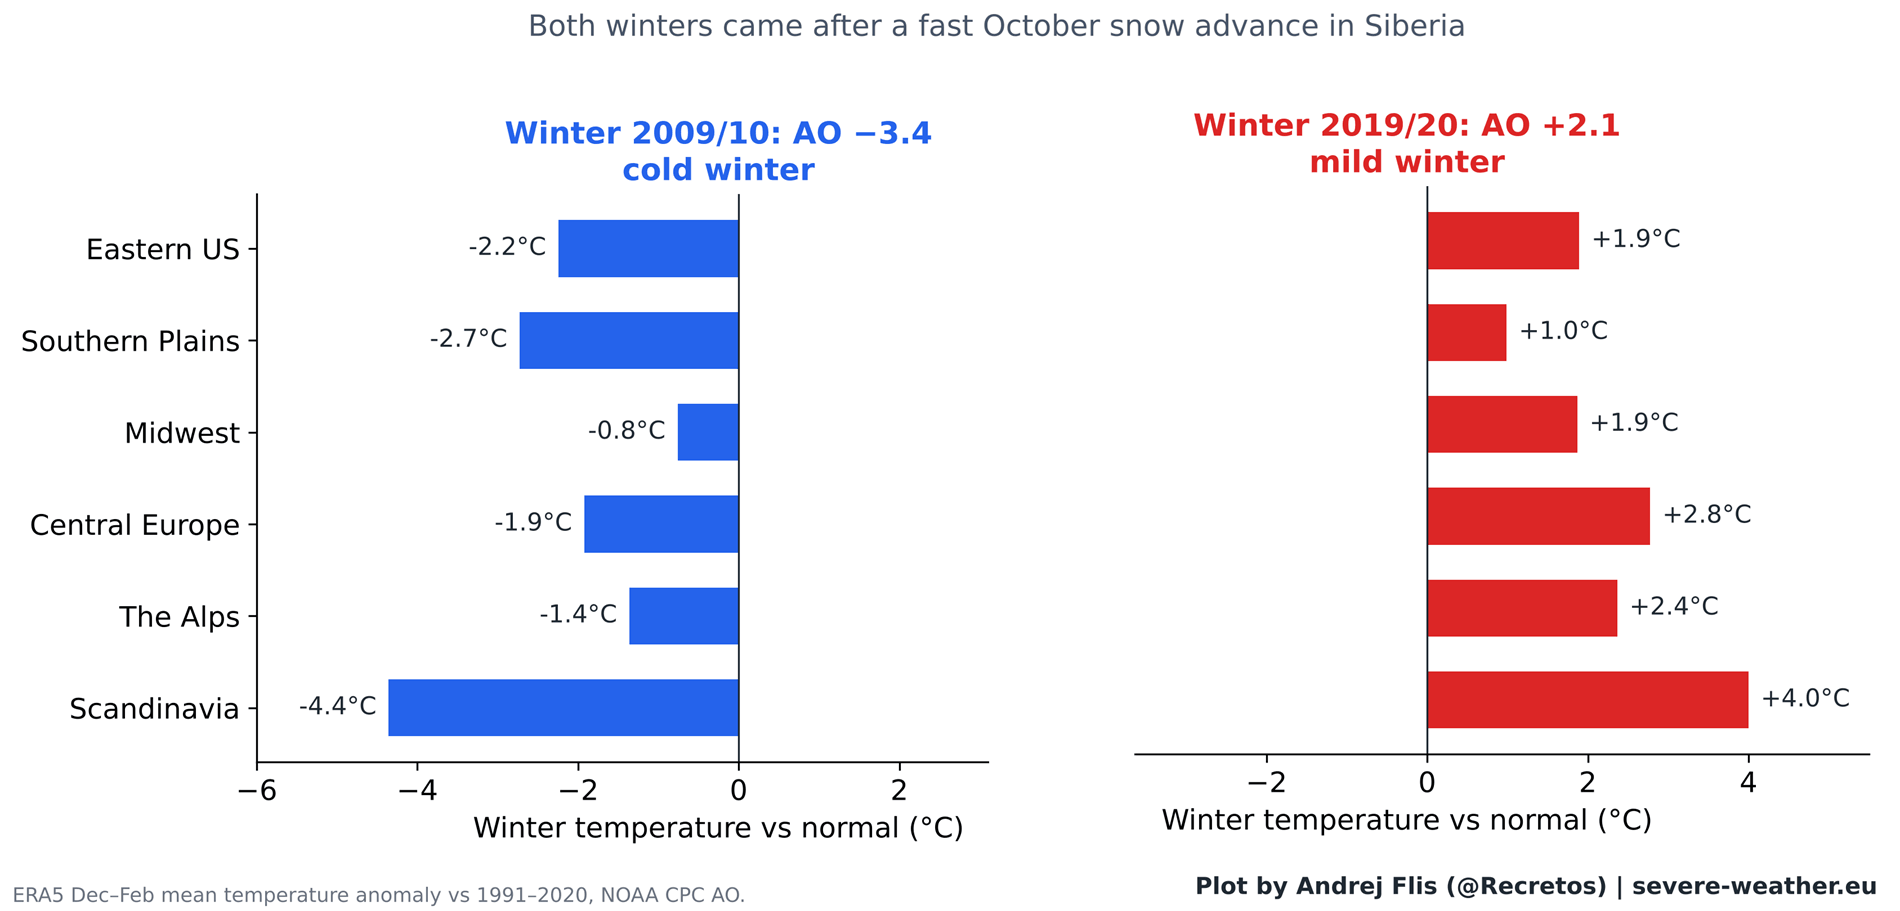
Supporting Data: Why Did the Theory Look So Convincing?
The illusion of a foolproof indicator was largely propped up by select extreme outliers.
- The Winter of 2009/2010: This season followed one of the fastest October snow advances on record and culminated in the most negative AO phase observed up to that point. It delivered punishing cold across Europe and the historic February 2010 "Snowmageddon" blizzards across the Eastern United States. It served as the textbook validation of the theory.
- The Counter-Example of 2019/2020: Conversely, the winter of 2019/2020 also followed a rapid October snow advance. Yet, it yielded one of the strongest positive AO phases and ranked as one of the mildest, nearly snow-free winters on record across Europe and large portions of the United States.
Where the Chain Breaks
Step-by-step testing of the atmospheric chain reaction reveals where the breakdown occurs. While the latter half of the theory remains intact—meaning that if excess energy flows into the stratosphere in November and December, the Polar Vortex will weaken in January and February—the initial trigger is failing.
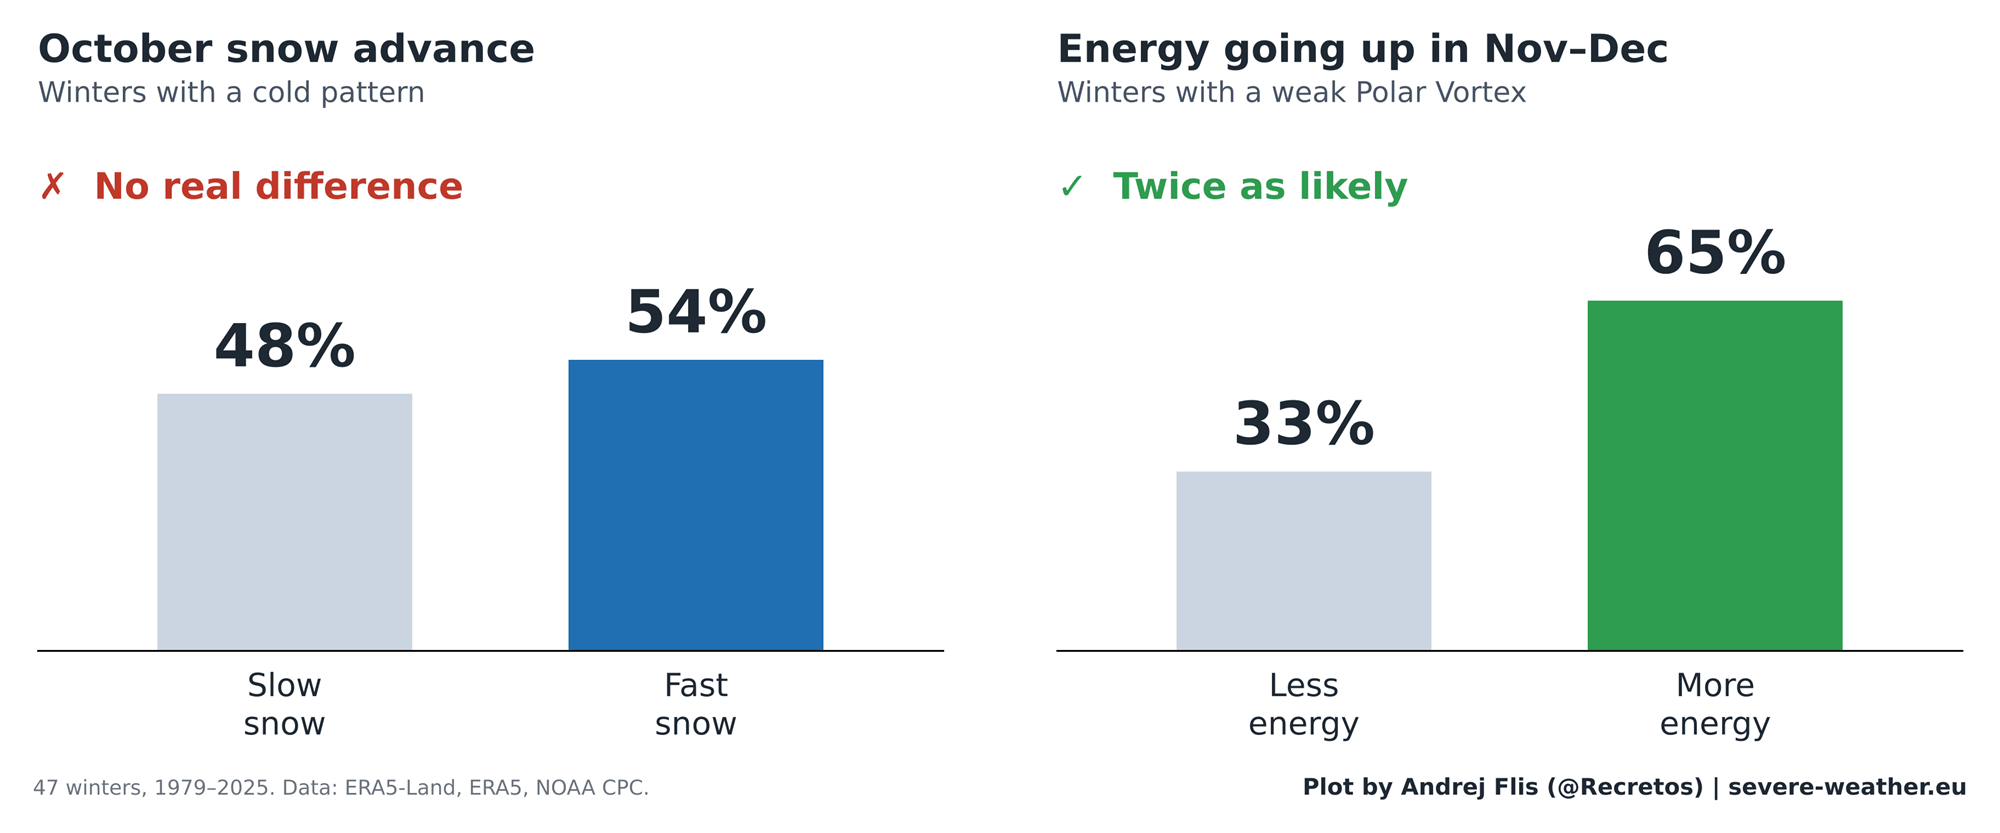
October snow no longer reliably strengthens the Siberian High in a way that consistently forces energy upward. Consequently, while the stratosphere still responds to thermal forcing from below, Siberian snow can no longer be trusted as the primary driver.
Official Responses and Broader Implications
Meteorologists and climatologists point to several potential reasons for the collapse of the snow-vortex correlation, including rapid Arctic sea-ice loss, shifting ocean temperatures, and alterations to the climatological baseline of the Siberian High. Furthermore, a new study published by climate researchers Songmiao Fan and Judah Cohen suggests that Eurasian snowpacks may now be linked more frequently to "stretched" rather than "disrupted" Polar Vortex configurations, altering how cold anomalies manifest geographically.
Regional Realities Across North America and Europe
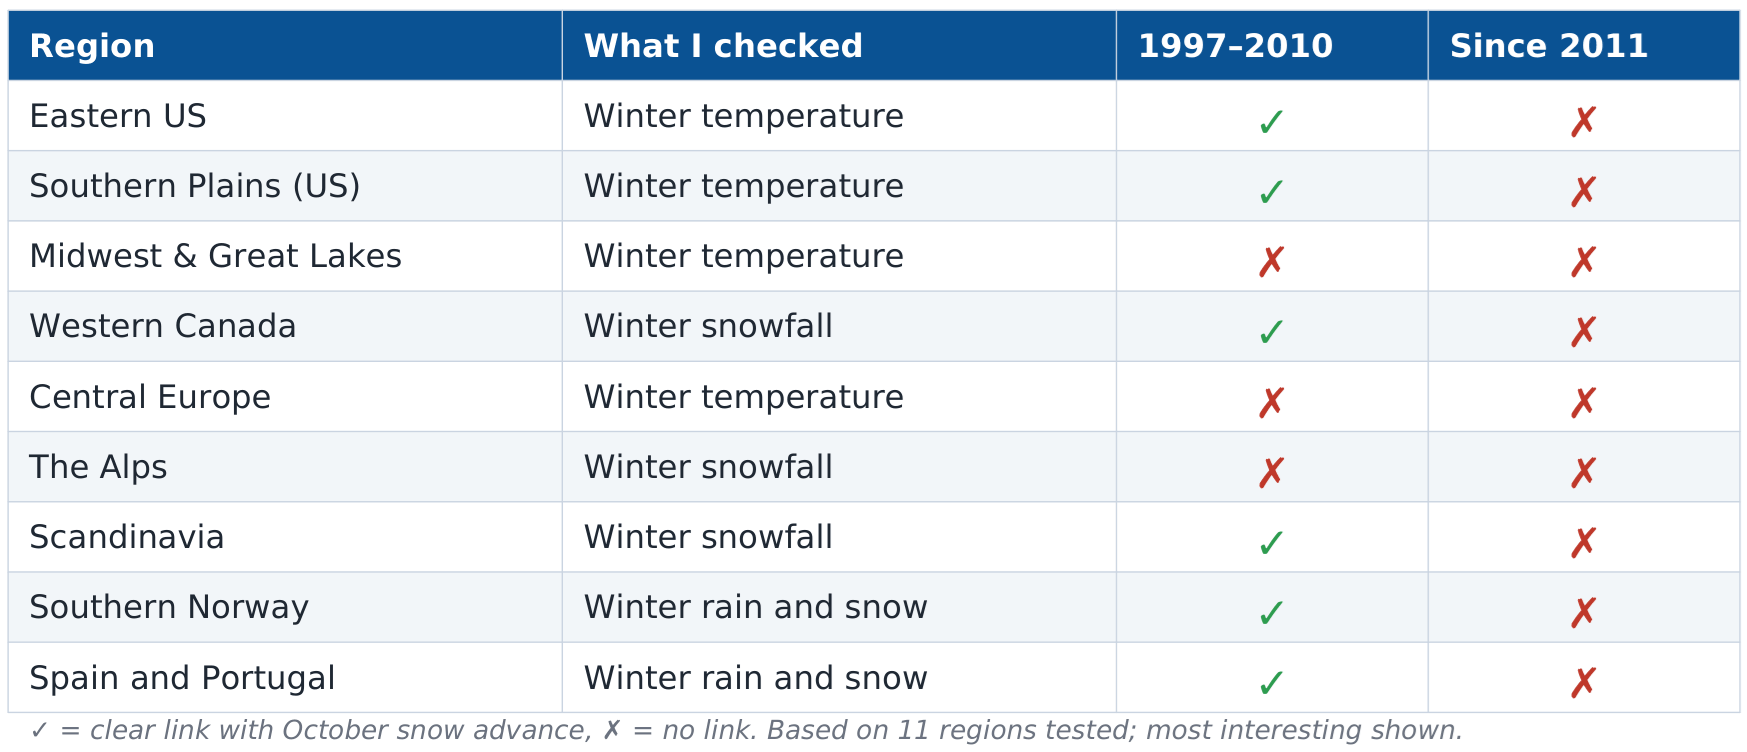
When examining localized impacts across 11 regions in North America and Europe, the breakdown is absolute. During the original study window, rapid snow advances correlated with colder winters in the eastern United States and distinct precipitation patterns in Europe. Since 2011, however, 43 out of 44 regional checks have shown a complete decoupling of the signal. Only Western Canada retains a faint, statistically insignificant hint of a long-term relationship.
Implications for Winter 2026/2027: Enter the Super El Niño
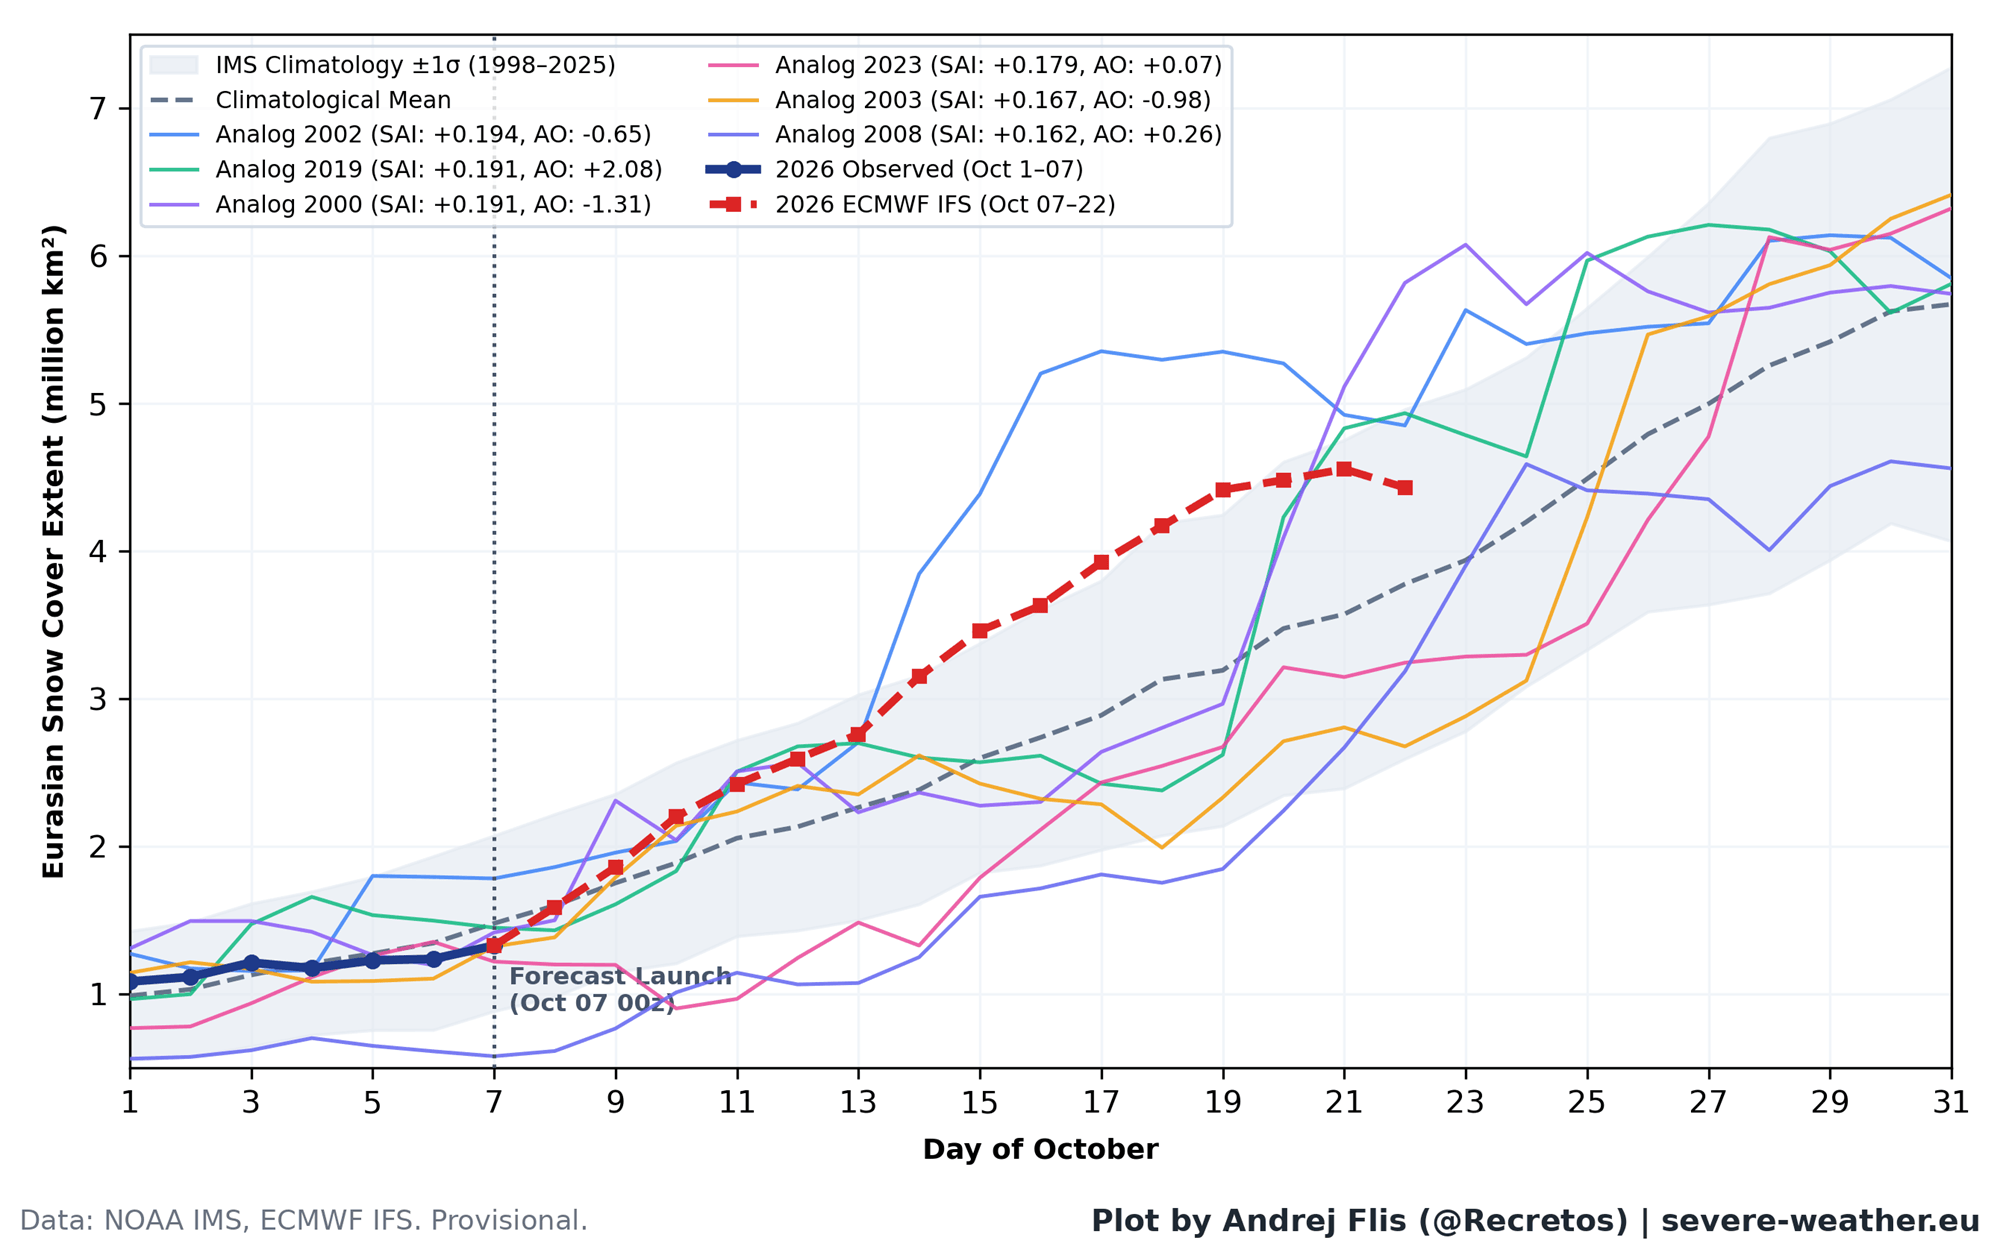
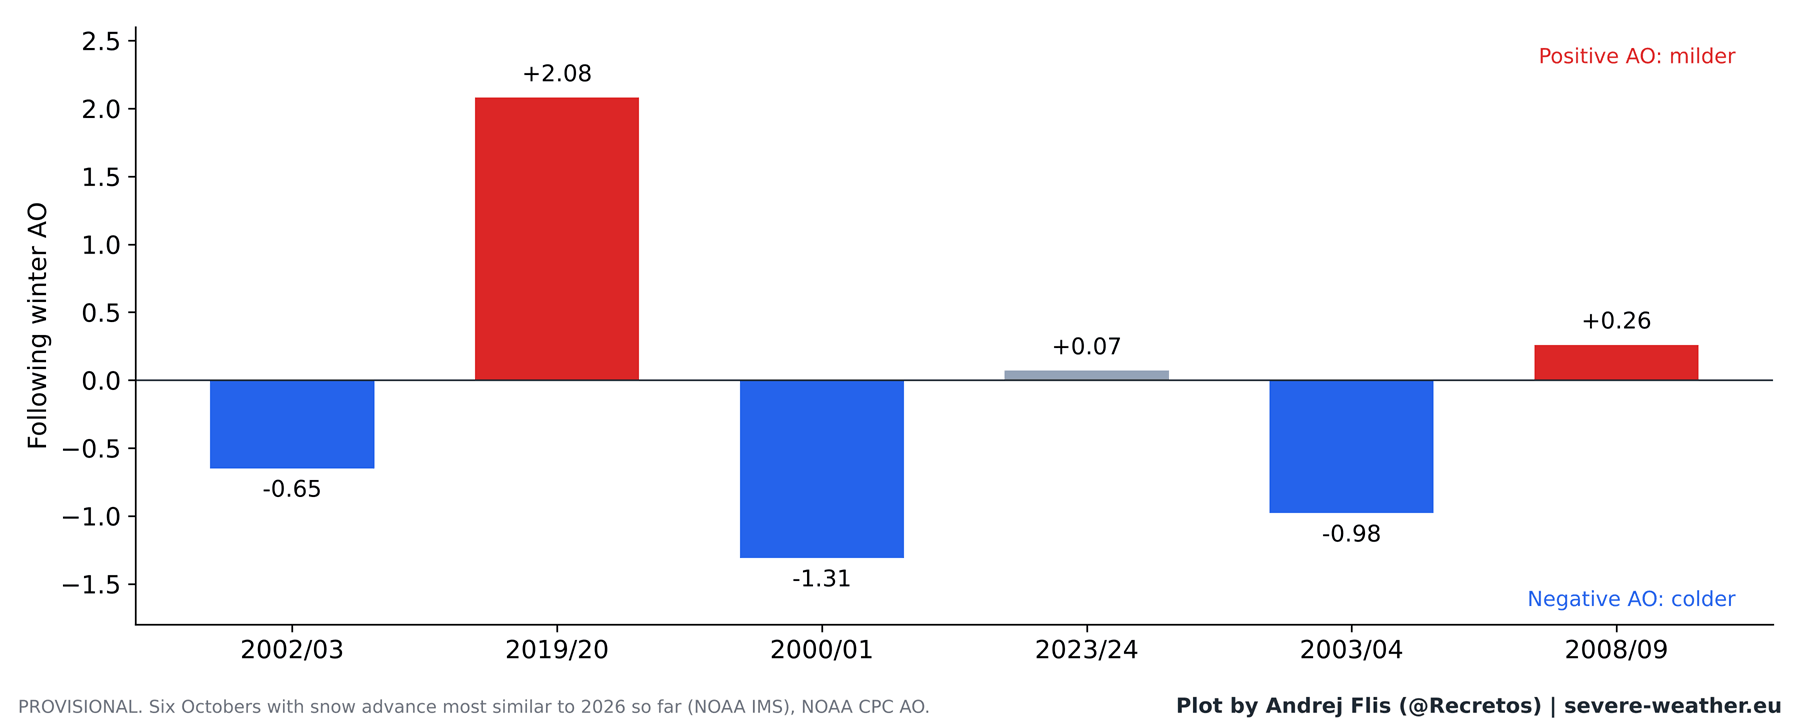
As forecasters evaluate the setup for the upcoming winter, current projections indicate a slow start to Eurasian snow cover in early October, followed by a potential sharp surge in the second half of the month. Historically, the six years featuring comparable October snow advances yielded mixed results: three negative AO winters, one neutral, and two positive. Therefore, relying on Siberian snow alone offers little clarity for the months ahead.
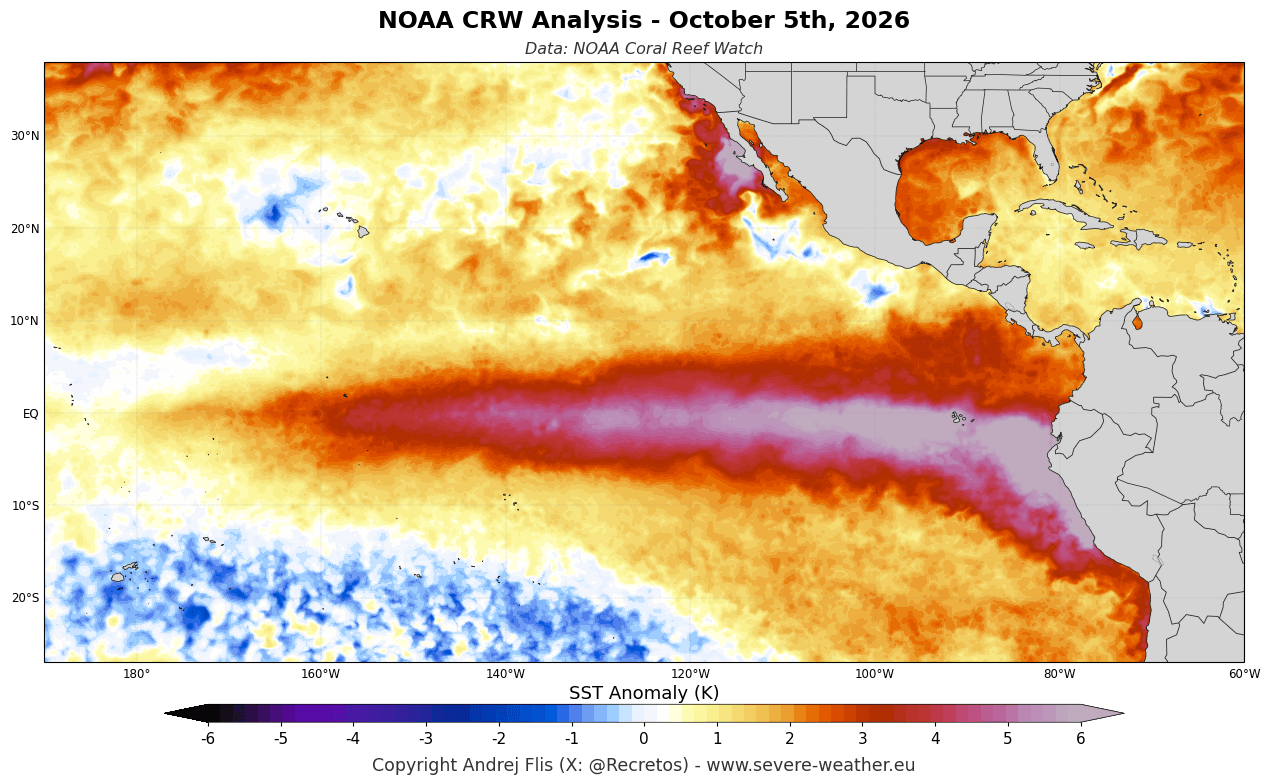
Instead, meteorologists are turning their attention to a much more dominant atmospheric driver: an active Super El Niño in the Pacific basin.
The Power of the Pacific
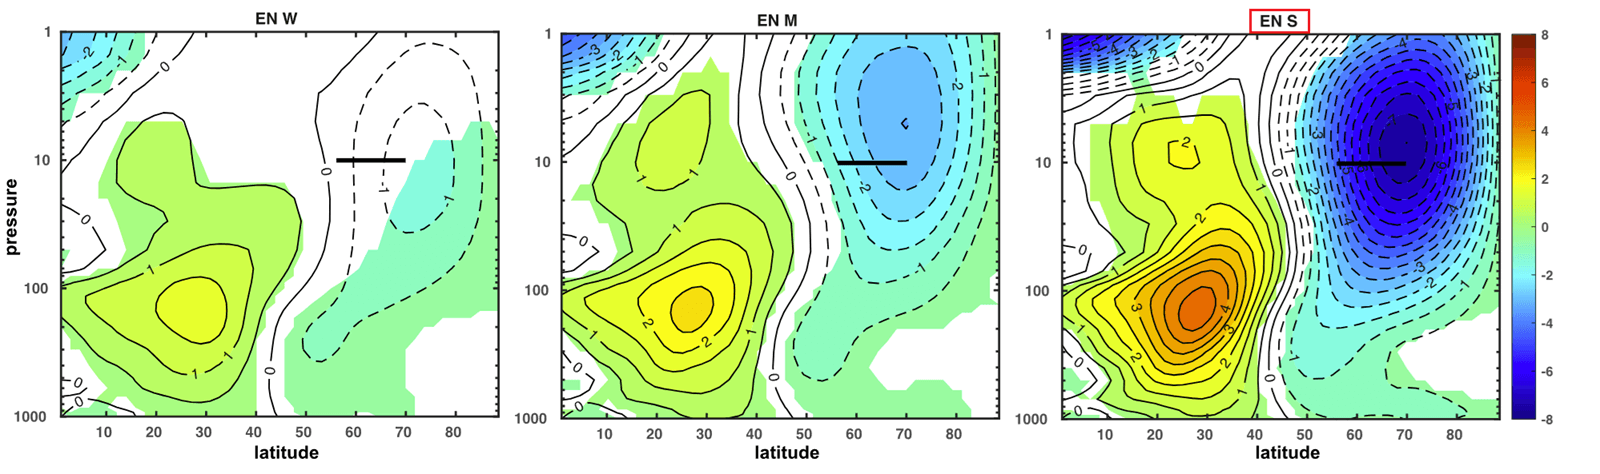
Current ocean temperature anomalies reveal a robust Super El Niño signature. Extensive modeling demonstrates that strong El Niño events exert a profound deceleration effect on the stratospheric Polar Vortex during mid-to-late winter.
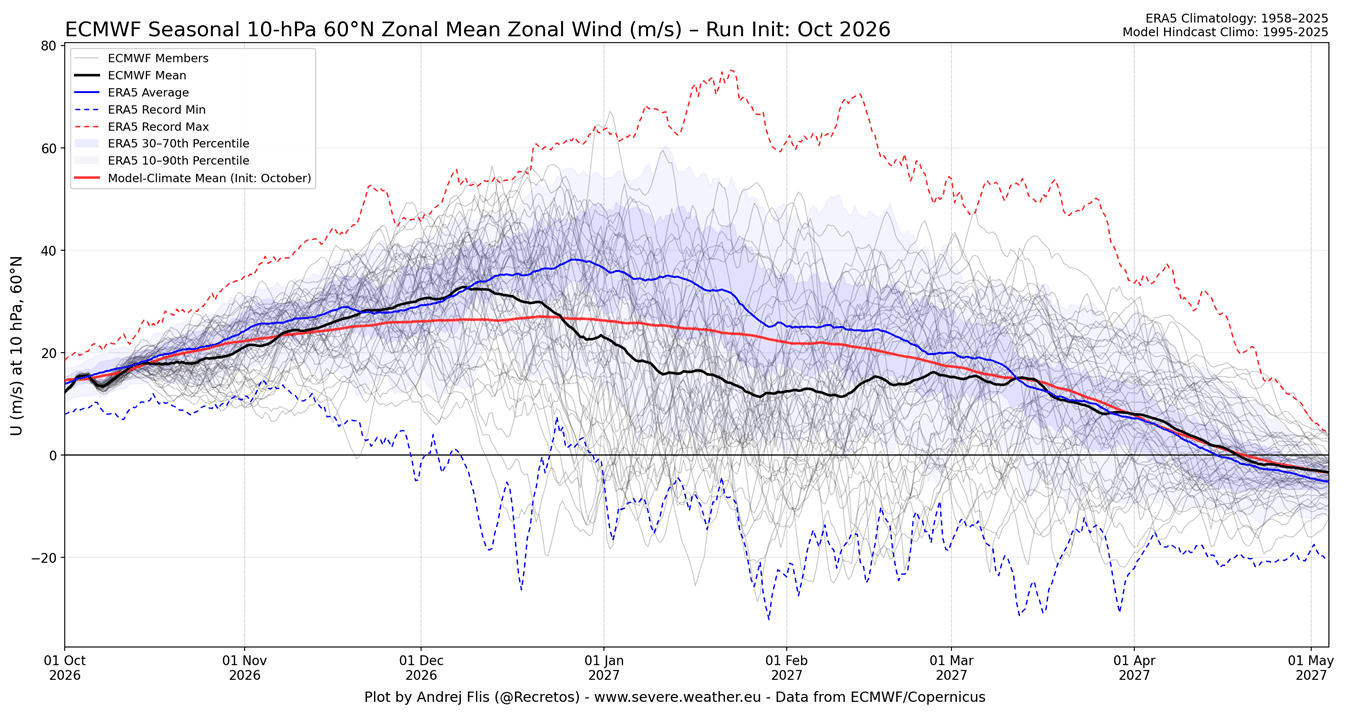
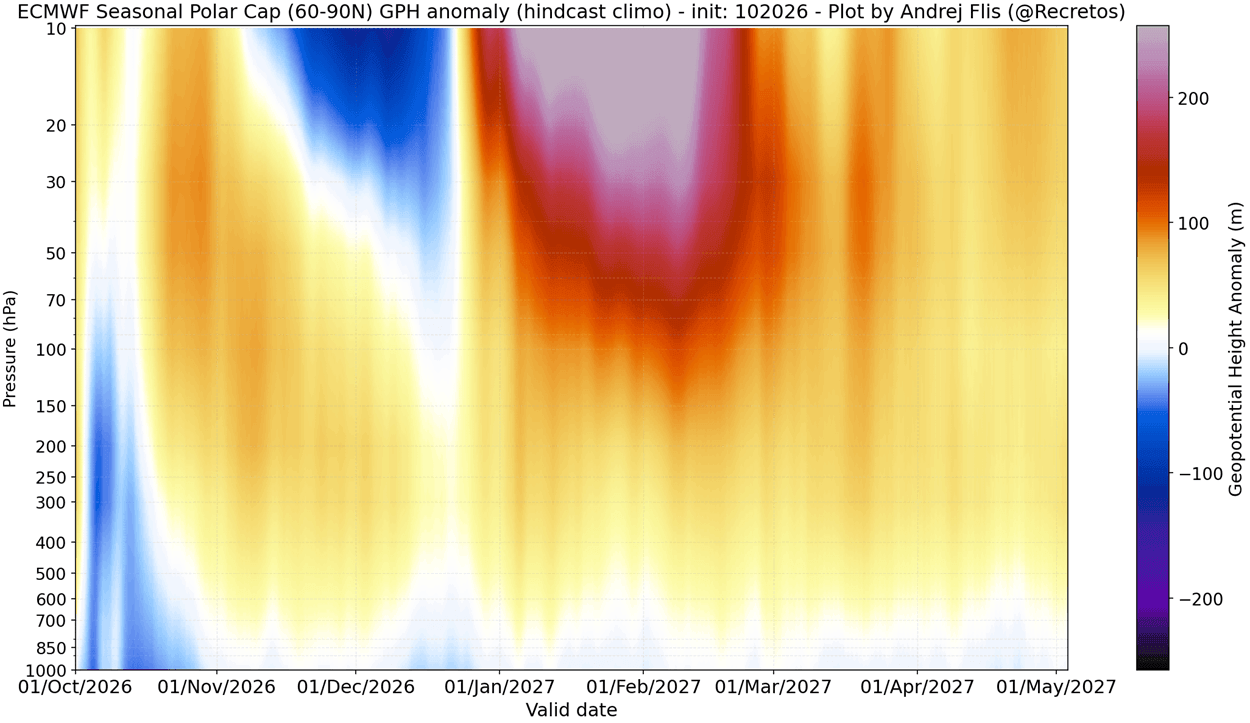
- Stratospheric Projections: ECMWF seasonal forecasts for zonal winds at the 10-hPa level indicate that while the Polar Vortex will remain near normal through mid-December, a significant wind deceleration is projected for January and February 2027. This points toward an elevated risk of a Sudden Stratospheric Warming (SSW) event—a structural collapse of the vortex.
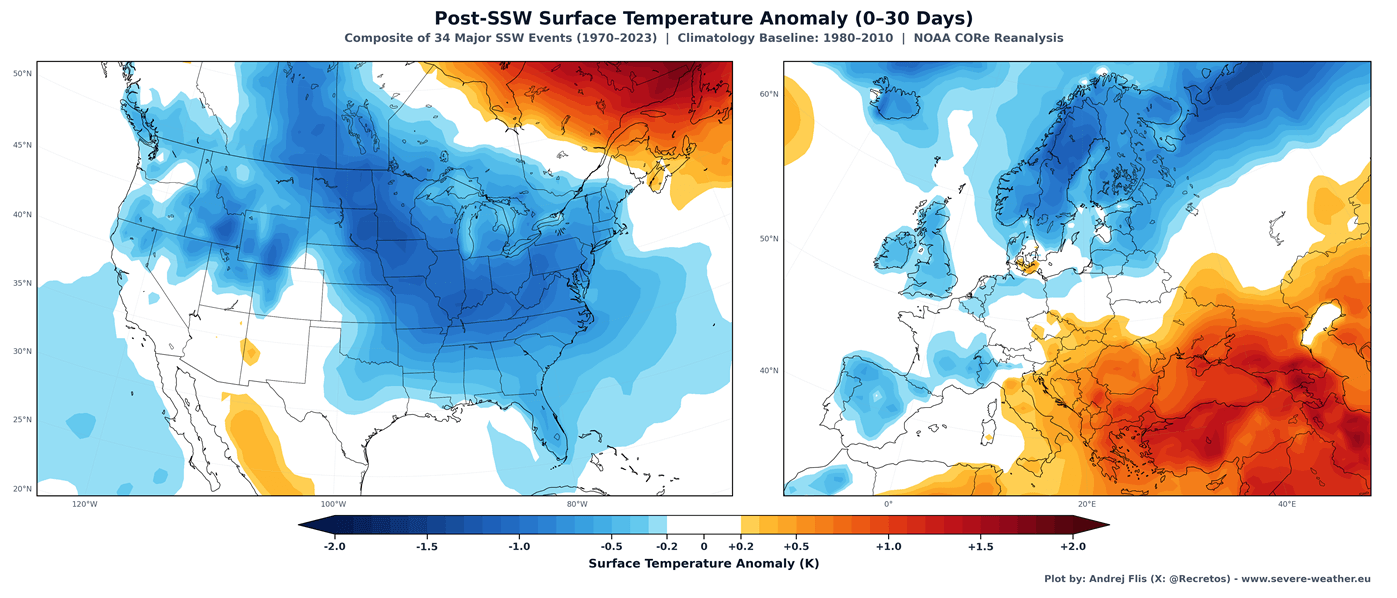
- Surface Weather Impacts: Following major Polar Vortex disruptions, historical composites suggest increased odds of cold-air outbreaks. However, the presence of a Super El Niño heavily modulates these outcomes.
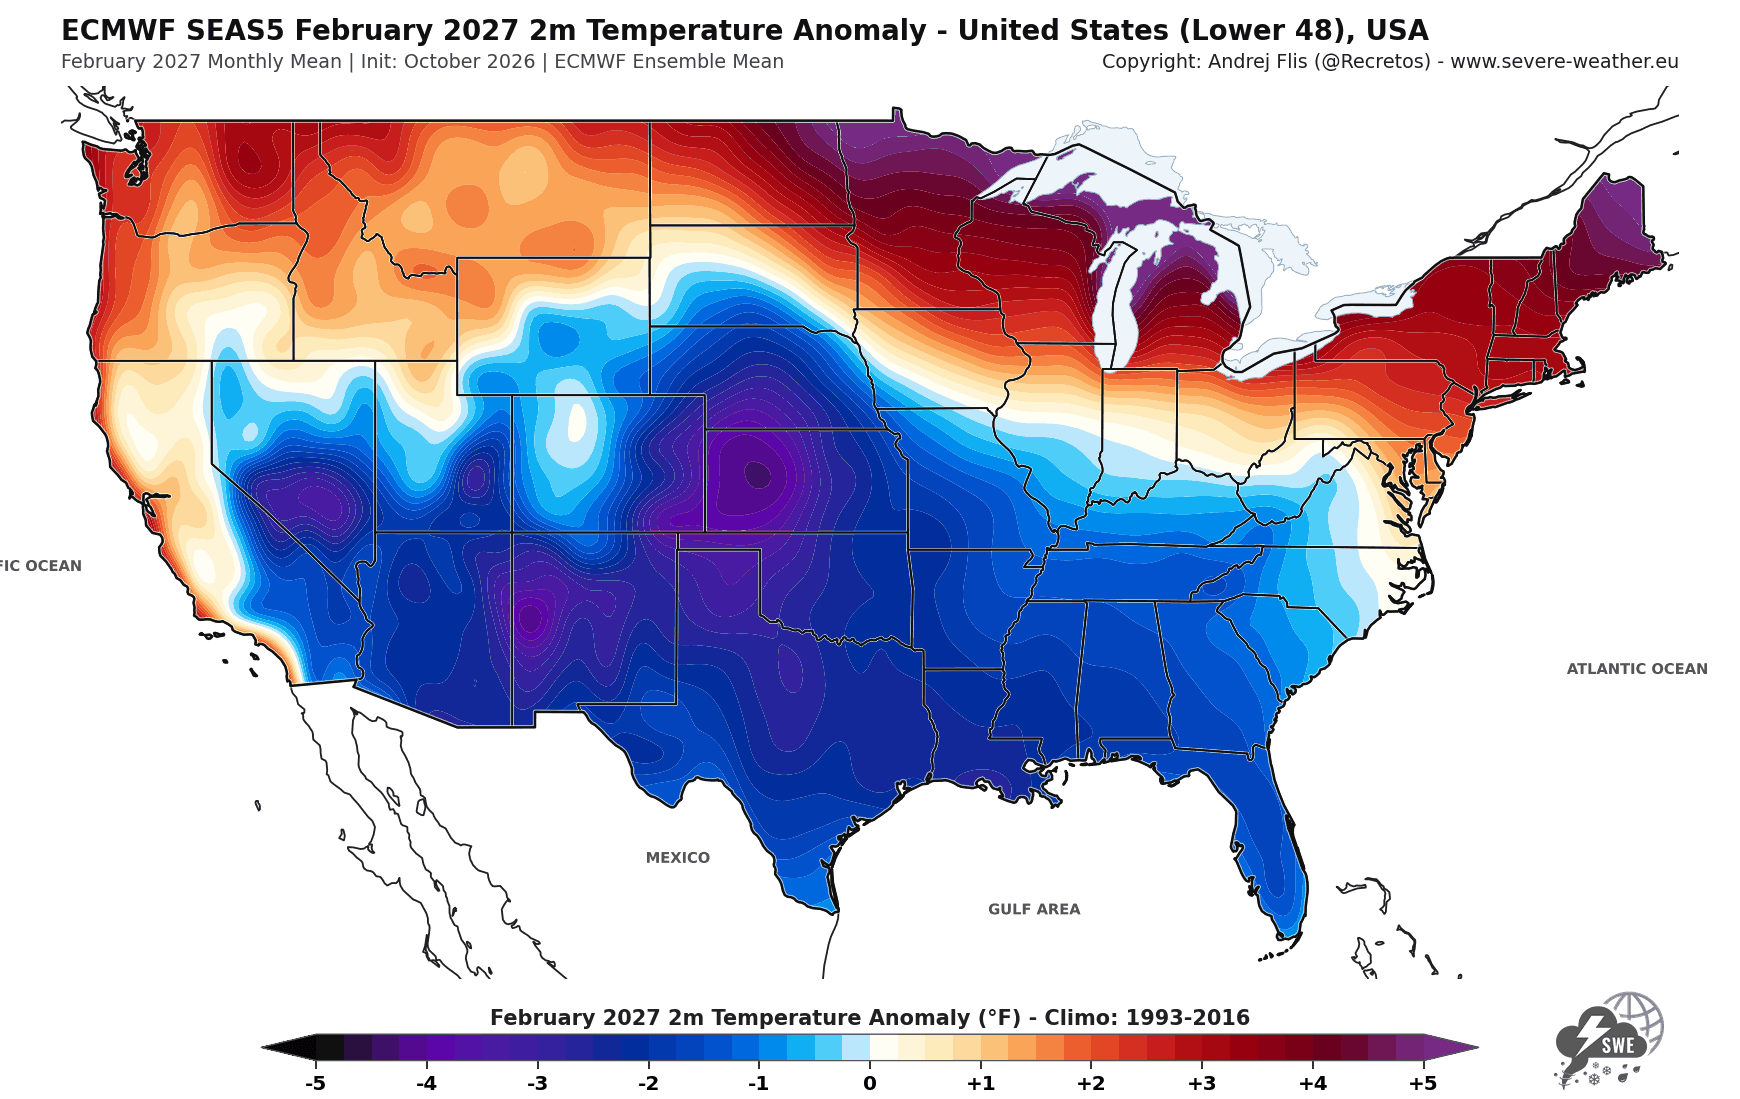
Current late-winter temperature outlooks favor colder-than-average anomalies across the central, southern, and eastern United States, driven by an amplified Pacific jet stream and persistent cloud cover. Conversely, Europe largely exhibits a milder signal, with cold anomalies primarily restricted to far northern Scandinavia, suggesting that any weak Polar Vortex impacts this season are statistically more likely to target North America.
A Note on Reanalysis Data Quirks
In the process of conducting multi-decadal meteorological research, data analysts issued a technical warning regarding standard reanalysis products: within the ERA5 dataset, Eurasian October snow cover exhibits an artificial 40% drop in 2004, coinciding with the integration of satellite snow mapping. Cross-verification with independent datasets (such as NOAA CORe and ERA5-Land) confirmed that this discrepancy is isolated to specific regional lowland parameters and does not invalidate the overarching macro-scale conclusions regarding the fading snow signal.
Conclusion
The pursuit of a single, all-encompassing pre-winter indicator remains the Holy Grail of long-range meteorology. While the Siberian snow advance theory provided a brilliant conceptual framework and captured the scientific imagination for over a decade, empirical data demonstrates that its predictive utility has faded in the modern climate era.
As Winter approaches, forecasters will leave the fading snow metrics behind, focusing instead on the verified dynamics of stratospheric wave energy transfer and the potent, record-breaking influence of the Pacific Super El Niño.
